I want to cover like some basics of probability before I get into Gaussians. Saliently, this covers LLN and CLT.
Why do I write this?
I wanted to create an authoritative document I could refer to for later. Thought that I might as well make it public (build in public, serve society and that sort of stuff).
Axioms of Probability
Imma just drone on about theory in this post.
Sample Space (): The sample space is the set of all possible elementary outcomes of a random experiment. Each outcome must be mutually exclusive and the set must be exhaustive.
Event Space (): An event is a subset of the sample space . The event space, denoted , is a collection of events to which we can assign probabilities. It is not always the set of all possible subsets (the power set), but it must be a -algebra, which is a collection of subsets of that satisfies three properties –
The empty set is included: .
Closure under complementation: If an event , then its complement is also in .
Closure under countable unions: If is a countable sequence of events in , then their union $latex
Probability Measure (): The probability measure is a function that maps an event in the event space to a real number. This function must satisfy the Kolmogorov Axioms –
Non-negativity: The probability of any event is non-negative.
Normalization (Unit Measure): The probability of the entire sample space is 1. This means that some outcome is guaranteed to occur.
Countable Additivity (or -additivity): For any countable sequence of pairwise disjoint events in (i.e., for ), the probability of their union is the sum of their individual probabilities.
Random Variables
A random variable is a function that assigns a real number to every possible outcome .
The key technical requirement is that this function must be measurable, which ensures that sets of the form are valid events in , allowing us to assign probabilities to them.
PDF and PMF
The behavior of a discrete random variable is described by its PMF, , which gives the probability of the variable taking on a specific value :
The PMF satisfies and .
The probability that a continuous random variable takes on any single specific value is zero. Instead, we describe its behavior with a PDF, . The probability of the variable falling within an interval is the integral of the PDF over that interval:
The PDF satisfies and . Note that, unlike a PMF, a PDF can have values greater than 1.
Also gonna throw this in here
A random variable is mixed if it has properties of both discrete and continuous variables.
Its probability distribution is a mixture of a PMF (for the discrete parts) and a PDF (for the continuous parts).
Conditional Probability, Independence, and the Chain Rule
Conditional Probability: The conditional probability of event occurring, given that event has already occurred, is denoted . It represents an update to our belief about in light of the new information that is true. It is defined as:
Geometrically, this is a re-normalization of the probability space: we restrict our attention to the outcomes within event and re-normalize their probabilities to sum to one.
Statistical Independence: Two events and are statistically independent if the occurrence of one does not provide any information about the occurrence of the other. Mathematically (this is all I care about rn ngl), this means:
Substituting this into the definition of conditional probability yields the more common test for independence:
Two random variables and are independent if this property holds for all possible values they can take: .
Chain Rule
In the language of random variables, for a set of variables , the chain rule allows us to express their joint distribution as:
Bayes’ Theorem
Bayes’ theorem provides a formal mechanism for inverting conditional probabilities.
Terminology
Hypothesis (): A proposition about the world whose truth we are uncertain about (e.g., “The patient has the disease,” “This email is spam”).
Evidence (): A new piece of data or observation that is relevant to the hypothesis.
Prior (): Our initial belief in the hypothesis before observing the evidence.
Likelihood (): The probability of observing the evidence if the hypothesis were true. This is the forward, generative model.
Posterior (): Our updated belief in the hypothesis after observing the evidence. This is the quantity we want to compute.
The theorem itself
The Marginal Likelihood (or Evidence): The denominator, , is the total probability of observing the evidence, averaged over all possible hypotheses. It is computed using the law of total probability: . It acts as a normalization constant, ensuring that the posterior probabilities sum to one.
The theorem can be written in a more memorable form using the terms:
Expectation, Variance and Moments
Imma just skip the basic stuff.
This is the Expectation of a Function –
Moments
Moments about the Origin: The -th moment of a random variable about the origin is defined as the expected value of :
The first moment, , is the mean.
Central Moments (Moments about the Mean): The -th central moment is the expected value of the -th power of the deviation from the mean, :
Random facts about central moments
The first central moment is always zero: .
The second central moment, , is the variance. It is the most important measure of the spread or dispersion of the distribution. It is denoted or . The standard deviation, , is the square root of the variance, returned to the original units of the variable.
The third central moment (normalized) is related to the skewness, which measures the asymmetry of the distribution.
The fourth central moment (normalized) is related to the kurtosis, which measures the “tailedness” or propensity for outliers.
Now, notice that the magnitude of the covariance is difficult to interpret because it depends on the units and variances of the individual variables.
A covariance of 100 might be very strong for one pair of variables but very weak for another.
To create a standardized, unit-free measure of the linear relationship, we normalize the covariance by the standard deviations of the two variables. This gives the Pearson correlation coefficient, –
: Perfect positive linear relationship.
: Perfect negative linear relationship.
: No linear relationship (uncorrelated).
Law of Large Numbers (LLN)
It says that that the average of a large number of independent samples from a distribution converges to the theoretical expected value of that distribution.
It is the theorem that guarantees that sampling works.
Theoretical Development: Forms of the Law
Weak Law of Large Numbers: This law states that for any arbitrarily small positive number , the probability that the sample mean deviates from the true mean by more than approaches zero as the sample size goes to infinity.
This is also called convergence in probability. It doesn’t guarantee that for a single long experiment the average will be close to the mean, but that it is overwhelmingly likely to be.
Strong Law of Large Numbers: This law makes a much stronger statement. It asserts that, with probability 1, the sample mean will converge to the true mean.
This is also called almost sure convergence. This guarantees that for a single, infinitely long experiment, the sample average will eventually settle down at the true population mean.
Why is this important in ML?
The LLN is the theoretical justification for Empirical Risk Minimization.
When we minimize a loss function on a finite training set, we are computing an empirical average. The LLN gives us confidence that, with enough data, this empirical risk will be a good approximation of the true expected risk over the entire data distribution.
Central Limit Theorem (CLT)
Foundations
The Question: The LLN tells us where the sample mean is going (it converges to ). The CLT tells us how it gets there: it describes the shape of the probability distribution of the sample mean around the true mean for a large but finite .
The Setup: Let be a sequence of i.i.d. random variables with finite mean and finite variance .
Theoretical Development
Theorem (Central Limit Theorem): As the sample size becomes large, the distribution of the sample mean approaches a normal (Gaussian) distribution with mean and variance .
More formally, the standardized version of the sample mean converges in distribution to a standard normal distribution:
Why’s this so cool?
The CLT is incredibly powerful because it holds true regardless of the shape of the original distribution of the . Whether the individual variables are from a uniform, Bernoulli, exponential, or any other well-behaved distribution, the distribution of their average will always tend towards a Gaussian bell curve.
This theorem explains the ubiquity of the Gaussian distribution in nature and science.
Many complex phenomena can be modeled as the sum or average of many small, independent random effects. According to the CLT, the distribution of this aggregate phenomenon will be approximately Gaussian, even if the individual effects are not. For example, measurement error in an instrument is often the sum of many small, independent sources of error, so it is well-modeled by a Gaussian.
Basically, Gaussians are common and this can be exploited.
I wanted to create an authoritative document I could refer to for later. Thought that I might as well make it public (build in public, serve society and that sort of stuff).
Rotations as linear transformations
As always, basics!
Isometry
The defining characteristic of a rigid body motion is that it preserves the distances between all points on the body.
A transformation that preserves distances is called an isometry.
In a vector space equipped with an inner product (and its induced norm), this means a transformation must preserve the norm of vectors and the angles between them. This is mathematically equivalent to preserving the inner product:
Orthogonal Matrices preserve norms
For any linear transformation represented by a matrix , the inner product preservation property is . This expands to .
This implies the defining property of an orthogonal matrix:
This means the inverse of an orthogonal matrix is its transpose, .
There you go, said it in a roundabout way since I’ve spoken about this atleast twice now:)
Distinguishing Rotations from Reflections
Orthogonal matrices represent all isometries that fix the origin.
This is a set which includes both rotations and reflections.
The determinant of an orthogonal matrix is always .
A transformation is said to preserve orientation (or “handedness”) if its determinant is positive.
A pure rotation is an orientation-preserving isometry. Therefore, a rotation is represented by an orthogonal matrix with a determinant of +1.
Special Orthogonal Group SO(n)
The set of all rotation matrices forms a mathematical group under matrix multiplication. This group is known as the Special Orthogonal Group, denoted .
E.g., represents rotations in the plane, and represents rotations in 3D space.
Rotations in 2D and 3D
Rotations in 2D, : The action of a 2D rotation on the standard basis vectors completely defines the transformation. A counter-clockwise rotation by an angle maps and . The columns of the rotation matrix are these transformed basis vectors, yielding:
Rotations in 3D can also be derived to be
Pre- and Post-Multiplication: The Duality of Coordinate Frames
This is actually a very important concept!
The non-commutativity of matrix multiplication () is not a mathematical inconvenience; it is the essential property that allows matrices to capture the non-commutative nature of 3D rotations. The choice of whether to pre-multiply () or post-multiply () depends entirely on the coordinate frame in which the new rotation is defined!
Foundations
Coordinate Frames
A coordinate frame, which we denote , is a coordinate system used to represent the position and orientation of objects. In , it consists of an origin point and a set of orthonormal basis vectors.
A vector’s components are only meaningful with respect to a specific frame.
We denote a vector expressed in frame as .
Active vs. Passive Transformations
A rotation matrix can be interpreted in two ways –
Active Rotation: The coordinate system is fixed, and the object (represented by a vector) is rotated. The matrix transforms the vector’s coordinates to new coordinates within the same frame. This is the more common interpretation.
Passive Rotation: The object is fixed in space, and the coordinate system is rotated. The matrix transforms the vector’s coordinates from the old frame to the new frame. This is a change of basis. A rotation of the frame by means the coordinates of a fixed vector in the new frame are given by times the old coordinates.
The choice between pre- and post-multiplication arises when we compose multiple rotations. This is best understood by considering two primary scenarios: rotations defined with respect to a fixed, global frame versus rotations defined with respect to a moving, local frame.
Scenario A: Pre-Multiplication (Rotations in a Fixed Global Frame)
This is the case where all rotations are defined with respect to the same, unchanging, external coordinate system.
This is called the world frame or global frame, which we will denote as .
Here, for two successive rotations, we write:
The new rotation matrix, , is pre-multiplied (multiplied on the left) to the existing rotation matrix, . The order of matrix multiplication ( then ) is the same as the order of application to the vector (first , then ).
Scenario B: Post-Multiplication (Rotations Relative to a Moving Local Frame)
This is the case where a sequence of rotations is defined with respect to the object’s own, changing coordinate system.
This is often called the body frame or local frame, which we will denote as .
The Transformation: An object initially has an orientation described by the matrix , which represents the orientation of its local frame with respect to the global frame . Let’s denote this as .
Composition: Now, we want to apply a second rotation, , but this rotation is defined relative to the object’s current, rotated frame, . This local rotation transforms frame to a new frame , and is denoted . We want to find the final orientation of the object, , in the global frame.
The Rule: To find the final orientation, we chain the transformations. The orientation of the new frame relative to the global frame is the orientation of in followed by the orientation of in . This corresponds to a matrix product:
If we let and , the final orientation is:
The new rotation matrix, , is post-multiplied (multiplied on the right) to the existing rotation matrix, .
How do you determine the choice?
The choice between these two conventions is not arbitrary; it is dictated by the problem’s physical or conceptual setup.
Convention
Pre-multiplication:
Post-multiplication:
Interpretation
Rotations are applied with respect to a fixed, external (world) coordinate system.
Rotations are applied with respect to the object’s own, moving (body) coordinate system.
Analogy
An air traffic controller describing an airplane’s orientation relative to the ground. “First turn 90 degrees North, then pitch up 20 degrees.”
A pilot inside the cockpit describing their maneuvers. “First I will pitch up 20 degrees, then I will yaw 10 degrees to my right.”
Application: Kinematic Chains
A robot arm is a chain of links, where each link’s frame is attached to the previous one. The orientation of link 2 is defined relative to link 1. The orientation of link 3 is defined relative to link 2, and so on. The orientation of the end-effector (frame ) with respect to the base (frame ) is the post-multiplication of the successive joint rotations:
Gimbal Lock
Getting back to , any arbitrary rotation is is a sequence of three rotations about principal axes, known as Euler angles (e.g., yaw, pitch, roll).
This suffers from a singularity where two of the three rotational axes align, causing the loss of one degree of freedom. This is called the Gimbal lock.
At this point, it is impossible to perform small rotations about one of the original axes, leading to instability in control and animation systems.
Real Numbers (): Ordered, commutative, associative. Lacks algebraic closure (e.g., has no real solution).
Complex Numbers (): Adds the imaginary unit where . The system is algebraically closed, commutative, and associative. It sacrifices the property of being an ordered field.
Quaternions (): Adds two more imaginary units, and . The system is associative but sacrifices the property of commutativity in multiplication (). This non-commutativity is not a flaw; it is the essential feature that allows quaternions to model non-commutative 3D rotations.
Octonions (): Adds four more units. The system is neither commutative nor associative, sacrificing associativity in multiplication ().
Quaternion Algebra
A quaternion is an element of the form:
where are real numbers, and form a basis for this 4D vector space.
is the scalar part, denoted .
is the vector part, denoted . A quaternion with a zero scalar part is called a pure quaternion.
The algebra is defined by the Hamiltonian rules for the basis elements:
This single, compact relation generates the entire non-commutative multiplication table:
The multiplication of two general quaternions and is defined by distributing terms and applying these rules. This leads to a more compact formula relating quaternion multiplication to the vector dot and cross products:
Quaternion Operations
Conjugate:. The conjugate of a product is the reversed product of the conjugates: .
Norm: The norm of a quaternion, , is a non-negative real number defined as:
This is the standard Euclidean norm in . The norm is multiplicative: .
Inverse: The multiplicative inverse of a non-zero quaternion is:
This ensures that is a division algebra: every non-zero element has an inverse.
Unit Quaternion: A quaternion with a norm of 1, . For unit quaternions, the inverse is simply the conjugate: . The set of all unit quaternions forms a 3-dimensional sphere () embedded in .
Geometry of 3D Rotations
Representing Rotations with Unit Quaternions
A rotation in is uniquely defined by an axis of rotation (a unit vector ) and a right-handed angle of rotation .
Euler’s Rotation Theorem states that any composition of rotations is equivalent to a single rotation about some axis.
I mean, this makes sense intuitive as well right? Not gonna prove it.
A unit quaternion represents such a rotation via the Euler-Rodrigues formula:
Notice the use of the half-angle $\theta/2$. This implies that
A rotation of about any axis corresponds to , and
A rotation of is required to return to the identity quaternion .
This mathematical structure is known as a double cover: the group of unit quaternions (denoted or ) is a double cover of the group of 3D rotations .
The two quaternions and correspond to the exact same physical rotation in 3D space.
The Sandwich Product
Embed: Lift the vector into the quaternion algebra by representing it as a pure quaternion :
Transform: Apply the rotation via the sandwich product:
Project: The result is guaranteed to be another pure quaternion. The vector part of is the rotated vector .
Composition of Rotations
If a rotation represented by is followed by a rotation represented by , the single composite rotation is represented by the quaternion product:
The non-commutativity of quaternion multiplication () correctly reflects the non-commutativity of 3D rotations (e.g., rotating 90 degrees about the x-axis then the y-axis is different from the reverse).
This is a significant advantage over Euler angles, where composition is complex and unintuitive.
Spherical Linear Interpolation (SLERP)
To smoothly interpolate between two orientations represented by unit quaternions and , we need to find a path of constant rotational velocity on the surface of the hypersphere.
This path is a great-circle arc.
What this means that it’s a circle arc in 4 dimensions. We use SLERP for this.
where is the interpolation parameter and is the angle between the four-dimensional vectors corresponding to and , given by .
This formula produces smooth, constant-velocity rotations, a feat that is notoriously difficult and unstable with Euler angles.
I want to try and cover every other kinda trivial / small things related to matrices / LinAlg in this. This covers
Affine spaces (This post!)
Inner products of functions (This post!)
Orthogonal projections (This post!)
Matrix approximation (This post!)
Rotations and quaternions
Why do I write this?
I wanted to create an authoritative document I could refer to for later. Thought that I might as well make it public (build in public, serve society and that sort of stuff).
Affine Spaces
Definition(s)
An affine space is a set of elements called points, together with a vector space , and an operation of vector addition that acts on points. This operation, , satisfies the following axioms:
For any point , .
For any point and any two vectors , .
For any two points , there exists a unique vector such that . This unique vector is denoted .
The vector space is called the direction space associated with the affine space .
Some other definitions
Affine Subspaces: An affine subspace of an affine space is a subset of that is itself an affine space with a direction space that is a vector subspace of . More concretely, an affine subspace is formed by taking a vector subspace and translating it.
where is a support point (an origin for the subspace) and is the direction space. A vector space is a special case of an affine subspace where the support point is the origin.
Parametric Representation: If the direction space has a basis , then any point in the affine subspace can be uniquely represented in parametric form as:
Examples include lines () and planes (). A hyperplane is an affine subspace of codimension 1 (i.e., of dimension in an -dimensional space).
Affine Mappings: An affine map between two affine spaces is a function that preserves the structure of affine subspaces. It can be shown that any affine map can be uniquely decomposed into a linear map on the underlying vector spaces plus a translation. In a coordinate system, this takes the familiar form:
where is the matrix of the underlying linear map and is a translation vector.
Very math stuff – what’s the use?
Use 1: Support Vector Machines!
The separating hyperplane in a Support Vector Machine (SVM) is actually an affine subspace!
In a -dimensional feature space, the hyperplane is defined by the set of points satisfying the equation:
Here, is the normal vector that defines the direction space’s orthogonal complement, and is a scalar related to the translation from the origin.
Inner Products (of functions)
Starting from dot products
The concept of an inner product on a space of functions is a direct generalization of the dot product on finite-dimensional Euclidean space .
The dot product in is defined as . It satisfies the axioms of an inner product: bilinearity, symmetry, and positive definiteness.
Now, a function can be conceptualized as an infinite-dimensional vector, where each point corresponds to a component with value . In this view, the discrete sum of the dot product becomes a continuous integral.
Further, to ensure the integrals are well-defined, we consider a vector space of functions, typically the space of square-integrable functions on an interval , denoted .
Formal Definition: The inner product of two real-valued functions and in the space is defined as:
More generally, a weight function can be introduced: .
Theoretical Development
Gonna info dump some things –
Induced Norm: The inner product induces a norm, known as the -norm, which measures the “length” or “magnitude” of a function:
Orthogonality of Functions: Two functions and are orthogonal if their inner product is zero:
Orthogonal Basis and Fourier Series: A set of functions is an orthogonal basis if its members are mutually orthogonal.
Where can I see this in action?
Use 1: Fourier Series
Functional analysis says that many well-behaved functions can be represented as a linear combination of orthogonal basis functions.
E.g., Fourier series, which represents a periodic function as a sum of sines and cosines, which form an orthogonal set on the interval .
The coefficient for each basis function is found by projecting onto it: .
Other than this, you can actually show that solutions relating to Kernel methods, unknown functions in robotics (e.g., friction), etc. can be written as inner products of functions.
Orthogonal Projections
What is it, exactly?
An orthogonal projection is a mapping that takes a vector and finds its closest point within a given subspace.
It is the formalization of the geometric idea of casting a shadow.
Ok, find, but what is it?
Given a vector space and a subspace , for any vector , we want to find the unique vector that is closest to . This is equivalent to minimizing the distance:
The solution to this minimization problem occurs when the “error” vector, , is orthogonal to the subspace . That is, for all .
This is basically the Geometric Condition!
Two Cases
You can either
Project onto a line, or,
Project onto a subspace
Projection onto a Line: The simplest case is projecting a vector onto the line spanned by a single non-zero vector . The projection is a scaled version of , . Using the orthogonality condition:
The projection is thus . In matrix form for the standard dot product in , this is represented by the projection matrix: .
Hold up here. Notice that is a vector. This is the vector of the projection. The magnituge of the projection, just the “size” of the shadow so to say, is the complement.
Projection onto a Subspace: This generalizes to projecting onto a subspace spanned by the columns of a matrix (with linearly independent columns). The projection is in the column space, so for some coefficient vector . The error vector must be orthogonal to the column space of . This means it must be in the left null space of :
This is the normal equation. Solving for and plugging back gives the projection :
The projection matrix is . If the columns of are orthonormal, then , and the formula simplifies to .
Wait this doesn’t make sense directly:( Ok, imma write it again!
Projection onto a subspace
Yes, its own section.
Concept
Projection onto a Line (1D)
Projection onto a Subspace (nD)
The “Ground”
A single line defined by one vector b.
A “floor” or subspace defined by multiple basis vectors, which are the columns of a matrix A.
The “Shadow”
The projection p is on the line, so it’s a scaled version of b.
The projection p is on the “floor,” so it’s a linear combination of the basis vectors in A.
Orthogonality
The error vector (b – p) must be orthogonal to the line’s direction vector b.
The error vector (b – p) must be orthogonal to the entire subspace. This means it must be orthogonal to every column of A.
Now, let’s derive!
State the Goal: We want to find the projection , which we know is a combination of ‘s columns: .
Use the Orthogonality Condition: The error vector () must be orthogonal to the column space of .
Substitute : Replace with what we know it is, .
Solve for the Coefficients : Distribute to get the normal equation. This equation’s name comes from the fact that it enforces the “normal” (orthogonal) condition.
Now, solve for the coefficient vector :
This formula gives us the perfect “recipe” of coefficients to create the projection.
Find the Projection Vector : Now that we have the recipe (), we can build the projection vector .
The projection matrix is the part that does all the work: . It’s a single matrix that takes any vector and spits out its projection onto the subspace defined by .
Where have we seen this?
The solution to the least-squares problem, , is found by solving the normal equation .
This solution, , is the orthogonal projection of the observed target vector onto the column space of the design matrix .
Matrix Approximation
I just wanted to add this as a heading since it’s not directly evident that this is just the EYM theorem discussed in depth within Matrix Decompositions 3. Anyway, here’s the statement again –
Theorem (Eckart-Young-Mirsky): Let the SVD of a matrix of rank be . The best rank- approximation to (for ) that minimizes the error (in both spectral and Frobenius norms) is given by the truncated SVD sum:
The theorem states that to get the best approximation, one should keep the components corresponding to the largest singular values and discard the rest. The singular values quantify the “importance” of each rank-one component.
Applications
Gosh, what’s not there?
Machine Learning (Principal Component Analysis): PCA is the most direct application of this theorem. It seeks the best rank-$k$ approximation of a centered data matrix. The SVD provides both the optimal subspace (spanned by the first $k$ right-singular vectors) and the coordinates of the data projected onto it.
Machine Learning (Recommender Systems): A user-item rating matrix is often very large, sparse, and assumed to be approximately low-rank. Low-rank matrix factorization, which is a form of matrix approximation, is used to fill in the missing entries. The SVD finds the optimal low-rank approximation, uncovering latent factors that describe user preferences and item characteristics.
AI (Natural Language Processing – Topic Modeling): In Latent Semantic Analysis (LSA), a large term-document matrix is constructed. Its low-rank approximation via SVD is used to find a “semantic space” where terms and documents with similar meanings are close together. The singular vectors represent abstract “topics.”
I’ve started reading DDIA! These are some short notes form Chapter 1.
Why do I write this?
I wanted to create an authoritative document I could refer to for later. Thought that I might as well make it public (build in public, serve society and that sort of stuff).
Also, just reading the textbook will in any case lead to forgetting parts of it. So, thought that I might as well (yay, repetition!) write some short notes for a quick overview later.
Introduction
Standard building blocks
Stuff that pretty much everyone is familiar with –
Databases
Caches
Search indexes
Stream processing
Batch processing
Why the single umbrella of data systems?
Soo many different things – why do we group them as one?
Many tools are optimizes for a variety of different use cases. E.g., Redis, a datastore, can also be used as a message queue.
Many apps demand multiple requirements that can be encompassed as a single application code.
How do you describe such systems?
Three things –
Reliability
Maintainability
Scalability
Reliability
Fault Tolerant or Fault Resistant?
Resistant. You cannot guarantee that no fault will ever occur.
Do we handle faults or failures?
A fault is one component of a system failing.
A failure is the system going down.
We handle failures.
Scalability
A system’s ability to cope with additional load.
Load parameters
How you describe the load. E.g., the number of writes / reads per second.
Describing Performance
What happens when the load increases?
Service Level Objectives (SLOs) and Service Level Agreements (SLAs)
Percentile based measurement
Coping with load
There are just two ways
Scaling up (vertical)
Scaling out (horizontal)
The best designs are generally a combination of the two.
Maintainability
I think this just revolves around the broader concepts of tech debts, but the major stuff are
Operability
Simplicity
Evolvability
Takeaways
Yeah, this was a very basic introductory chapter that was (kinda?) trivial since I had done distributed systems in school. The main takeaways are:
Access patterns matter!
There is no one solution.
You should always factor in reliability, scalability and maintainability.
(perhaps the most important) Singular Value Decomposition (This post!)
Why do I write this?
I wanted to create an authoritative document I could refer to for later. Thought that I might as well make it public (build in public, serve society and that sort of stuff).
What if the matrix is not square?? We use SVD! Wait lemme explain:
Any linear transformation maps the set of unit vectors in the input space (a unit sphere in ) to a hyperellipse in the output space .
This is the main geometric insight of the SVD –
This hyperellipse lies within a subspace of the codomain. The SVD provides a complete characterization of this transformation by identifying the specific orthonormal basis vectors in the input space that are mapped directly onto the principal axes of this resulting hyperellipse.
Formal definition!!
Theorem (Singular Value Decomposition): For any matrix of rank , there exists a factorization of the form:
where the components have the following properties:
is an Orthogonal Matrix. The columns of , denoted , are the left-singular vectors. They form an orthonormal basis for the output space (codomain), . The first of these vectors, , form an orthonormal basis for the column space (range) of . Geometrically, these are the unit vectors that define the directions of the principal axes of the output hyperellipse.
is an Orthogonal Matrix. The columns of , denoted , are the right-singular vectors. They form an orthonormal basis for the input space (domain), . The first of these vectors, , form an orthonormal basis for the row space of . Geometrically, these are the specific orthonormal vectors on the input unit sphere that are mapped by onto the principal axes of the output hyperellipse.
is a Rectangular Diagonal Matrix. The only non-zero entries of are on its main diagonal. These entries, , are the singular values of . They are real, non-negative, and by convention, sorted in descending order:
The number of non-zero singular values is exactly the rank of the matrix . Geometrically, each singular value is the length of the -th principal semi-axis of the output hyperellipse.
Woah! Column space, row space? What?
Actually, I’ll call this –
An Exposition on the Fundamental Subspaces of a Linear Transformation
The most profound insights into the nature of this transformation are revealed by analyzing four special vector subspaces that are intrinsically associated with the matrix . These are the four fundamental subspaces. Understanding them provides a complete geometric and algebraic picture of the action of the matrix.
Subspace 1: The Column Space (or Range)
The column space of a matrix , denoted or , is the set of all possible linear combinations of its column vectors. If the columns of are , where each , then:
Notice how the column space is the set of all vectors for which the system has a solution.
Subspace 2: The Null Space (or Kernel)
The null space of a matrix , denoted or , is the set of all solutions to the homogeneous linear system .
The null space answers the question: “What is the set of all input vectors that get crushed or annihilated by the transformation?”
For a system , if a solution exists (a particular solution), then the set of all solutions is given by .
The null space thus describes the ambiguity or non-uniqueness of the solution.
Subspace 3: The Row Space
It is equivalent to the column space of .
Subspace 4: The Left Null Space
The left null space of a matrix is the set of all solutions to the homogeneous system .
It is called the “left” null space because the equation can be written as , where the vector is on the left.
Notice how the left null space contains all vectors in the output space that are orthogonal to every vector in the column space.
It represents the part of the codomain that is “unreachable” by the transformation.
The Rank-Nullity Theorem
Theorem (Rank-Nullity Theorem): For any matrix :
or, using the definition of rank:
Interpretation: The dimension of the input space () is partitioned between two subspaces: the part that is mapped to the column space (the row space, whose dimension is the rank) and the part that is crushed to zero (the null space).
The Fundamental Theorem of Linear Algebra
Part 1: Dimensions
By applying the Rank-Nullity theorem to both and its transpose , we arrive at a complete description of the dimensions of all four fundamental subspaces:
Part 2: Geometry
The row space and the null space are orthogonal complements in the input space .
The column space and the left null space are orthogonal complements in the output space .
Theoretical development
From eigendecomposition
Consider the matrix . By construction, is symmetric () and positive semi-definite ().
By the Spectral Theorem, any real symmetric matrix has a full set of orthonormal eigenvectors and real, non-negative eigenvalues. Therefore, admits an eigendecomposition:
where is an orthogonal matrix of eigenvectors and is a diagonal matrix of eigenvalues .
Now, substitute the SVD form into this expression:
Since is orthogonal, , which simplifies the expression to:
Comparing this with the eigendecomposition , we establish the following fundamental relationships:
The right-singular vectors of (the columns of ) are the eigenvectors of .
The eigenvalues of are the squares of the singular values of , i.e., .
A symmetric argument applies to the matrix :
This reveals that:
The left-singular vectors of (the columns of ) are the eigenvectors of .
The non-zero eigenvalues of are identical to the non-zero eigenvalues of , and are also equal to .
Singular values and geometry
The relationship between the components can be summarized by the singular value equations, derived by right-multiplying by :
Considering this equation one column at a time, for :
This equation provides the geometric interpretation:
The linear transformation maps the -th right-singular vector (an orthonormal basis vector in the domain) to a scaled version of the -th left-singular vector (an orthonormal basis vector in the codomain).
The scaling factor is the -th singular value.
Reduced SVD
What if or ? We use the reduced version!
Full SVD: The form described above, where is and is .
Reduced SVD: If , the matrix will have rows of all zeros. These rows, when multiplied by , contribute nothing to the final product. The reduced SVD eliminates these zero rows and the corresponding columns of :
where , (now a square diagonal matrix), and . This is a more memory-efficient representation.
Applications
Low-Rank Approximation and Principal Component Analysis (PCA)
The expression represents as a weighted sum of rank-one matrices. The Eckart-Young-Mirsky Theorem states that the optimal rank- approximation of (the matrix that minimizes ) is found by truncating this sum:
What does this mean? You select the ones corresponding to the largest singular values:) This is what’s used in PCA! (PCA, Spectral Clustering and t-SNE)
Moore-Penrose Pseudoinverse and Linear Regression
For any matrix , the SVD provides its pseudoinverse: , where is formed by taking the reciprocal of the non-zero singular values in and transposing.
In ML: The solution to the linear least-squares problem, , is given by .
The condition number of a matrix , which measures the sensitivity of the solution of to perturbations in the data. It is defined as
Aside: Eckart-Young-Mirsky Theorem
Matrix norms
Spectral Norm: The maximum scaling factor the matrix can apply to any unit vector: . It can be proven that this is equal to the largest singular value, .
Frobenius Norm: The matrix equivalent of the vector Euclidean norm, defined as the square root of the sum of the squares of all its elements: . It can be proven that this is equal to the square root of the sum of the squares of its singular values: .
Theorem
Let the SVD of be . The best rank- approximation to (for ), denoted , is the one that minimizes the approximation error . For both the spectral and Frobenius norms, this minimum is achieved by the truncated SVD sum:
The approximation error is given by:
This theorem guarantees that truncating the SVD provides the most compact linear approximation of a matrix for a given rank, capturing the “most important parts of M” by retaining the components with the largest singular values.
Aside: Intuitions for SVD
I highly suggest looking up Six (and a half) intuitions for SVD, but here are some things that aren’t directly covered earlier in this blog:
Theoretical development for Moore-Pensore inverse
We substitute the SVD of into the objective function and use the property that the L2 norm is invariant under orthogonal transformations:
By defining a change of variables and , the problem becomes . Since is diagonal, this is a sum of independent squared errors:
The minimum is achieved when for , yielding . For , is unconstrained as ; the minimum-norm solution sets these to zero. Transforming back gives the solution:
where is the Moore-Penrose Pseudoinverse.
Listing the intuitions
We have mostly coverered all of these above btw,
Rotations and Scalings (The Geometric Picture)
Best Rank-k Approximations
Least Squares Regression
Input and Output Directions
Lost & Preserved Information
PCA and Information Compression
Yay, we are (mostly) done with matrix decompositions!
(perhaps the most important) Singular Value Decomposition
Why do I write this?
I wanted to create an authoritative document I could refer to for later. Thought that I might as well make it public (build in public, serve society and that sort of stuff).
QR Decomposition
Basics?
Yeah, you remember vector spaces and orthogonality? Yeah, that’s it.
Ok, what is it?
A factorization of a matrix into the product of two specific types of matrices: an orthogonal matrix and an upper triangular matrix .
Definition (QR Decomposition): Let be an matrix with linearly independent columns. The QR decomposition of is a factorization:
where:
is an matrix with orthonormal columns. Thus, , where is the identity matrix.
is an upper triangular matrix. This means all entries below the main diagonal are zero ( for ).
R? Right? Right-upper? And Q preceded R? Get it? Idk.
Ok, but why?
Orthogonal matrices are awesome.
QR decomposition formalizes a process of transforming an arbitrary basis (the columns of ) into an orthonormal basis (the columns of ), while encoding the transformation information in the upper triangular matrix .
How do I do it?
Gram-Schmidt process!
This handout from UCLA is awesome. I have realised that I’m not made out of time and want to make these notes more for intuition and rigorous math only for places that I deem super important (around ~50%).
Applications!!
This is why I do this – yayyy (first time I got to this section in under ~20 minutes).
Solving Linear Systems and Least-Squares Problems
In robotics?
Solving Linear Systems and Least-Squares Problems
Say we want to solve . We can write –
Since is orthogonal, . We can multiply by :
This new system is trivial to solve because is upper triangular. We can solve for the components of starting from the last one and moving upwards, a process known as back substitution.
Now, for the linear least squares regression.
The objective is to find the vector that minimizes the squared Euclidean norm of the residual:
That means, for us,
How did we do this? Orthogonal transformations preserve the Euclidean norm!!!
Very cool and smart sounding, right? But, why did we do this?
The main issue lies with the formation of . It has a high condition number and is less numerically stable.
A condition number is a score that measures how sensitive a function or a matrix is to small changes in its input.
This means that –
A low condition number means a matrix is well-conditioned. Small changes in the input data will only cause small changes in the output or solution. This is stable and reliable.
A high condition number means a matrix is ill-conditioned. Tiny, insignificant changes in the input data can cause huge, dramatic changes in the solution. This is unstable and unreliable.
In numerical calculations, an ill-conditioned matrix can amplify tiny rounding errors into completely wrong answers.
Forming the matrix can be disastrous for numerical stability. Mathematically, the condition number of is the square of the condition number of .
This means that if your original matrix is even slightly ill-conditioned, the matrix you need to work with will be extremely ill-conditioned.
The QR method is superior because it cleverly bypasses the need to form the unstable matrix.
Decomposition: First, it decomposes the original matrix into , where is an orthogonal matrix and is an upper triangular matrix. This decomposition process itself is numerically stable.
Stable Transformation: The next step uses a key property of orthogonal matrices: they don’t change the length (Euclidean norm) of vectors when they multiply them. This allows the problem to be transformed without amplifying errors:
This transformation is numerically stable because the condition number of is the same as the original matrix . We haven’t made the problem worse:))))
In Robotics?
Literally anywhere you use least squares. Example – Levenberg-Marquardt algorithm in inverse kinematics:)
Cholesky decomposition
Axiomatic basis
We do have something for this!
The entire theory of Cholesky decomposition rests upon the properties of Symmetric Positive Definite (SPD) matrices. Let be a square matrix.
Symmetry: The matrix is symmetric if it is equal to its transpose, . This means for all (the more you know!).
Positive Definiteness: A symmetric matrix is positive definite if for every non-zero vector , the quadratic form is strictly positive.
Key Properties of SPD Matrices:
All eigenvalues of an SPD matrix are real and strictly positive.
All diagonal elements () are strictly positive.
The matrix is always invertible (since no eigenvalue is zero).
Proofs!
What is it?
Let be a symmetric, positive definite matrix. Its Cholesky decomposition is a factorization of the form:
where:
is a lower triangular matrix with strictly positive diagonal entries ().
is the transpose of , which is an upper triangular matrix.
Isn’t this very specific?
So, why do we need this?
Ee often need to generate random samples from a multivariate Gaussian distribution . The covariance matrix is, by definition, SPD.
How do we use it?
Generate Standard Normal Variates: Generate a vector where each component is an independent sample from the standard normal distribution . This vector has a mean of and a covariance matrix of .
Decompose: Compute the Cholesky factor of the target covariance matrix, .
Transform: Create the desired sample using the affine transformation:
This works because the mean and covariance of the transformed variable are:
.
. The Cholesky decomposition provides the correct linear transformation to “color” the uncorrelated noise into the correlated noise specified by .
LU decomposition
Definition
The LU decomposition of a square matrix is a factorization:
where is a unit lower triangular matrix and is an upper triangular matrix. Not every matrix has an LU decomposition. However, if row swaps are allowed, a stable factorization is always possible. This leads to the more general form , where is a permutation matrix that records the row swaps.
How do I do it?
Remember how Guassian elimination does elementary operations? And, these elementary operations can be written as elementary matrices? So, we can do –
Now, if you work it out – the elementary matrices will be lower triangular and their product will also be lower triangular. A nice property is that these lower triangular elementary matrices is that their product is also simple: the multipliers slot directly into the matrix.
Now, what if one of the pivots is 0? Or like, super small – leading to instability?
To prevent this, we perform pivoting: swapping the current row with a subsequent row that has a larger pivot element.
Each row swap can be represented by left-multiplication with a permutation matrix. A permutation matrix is an identity matrix with its rows reordered. Applying all necessary row swaps to at the beginning gives the general and stable form of the decomposition:
This factorization exists for any square matrix .
Applications
Literally any decomposition can help Solving Linear Systems easier. I’m gonna skip this but that’s the primary use (again).
Other than that, the decomposition provides an efficient way to calculate the determinant.
(since it is unit triangular).
(the product of its diagonal elements).
, where is the number of row swaps performed. Therefore, .
It’s a document on PCA, Spectral Clustering and t-SNE, duh? All of these are used to make sense of the structure of data. More importantly, all of these are intricately related to eigendecomposition (Matrix Decompositions 1).
Why do I write this?
As always, I wanted to create an authoritative document I could refer to for later. Thought that I might as well make it public.
Principal Component Analysis (PCA)
What’s this used for? We use it to find a lower-dimensional linear subspace of a high-dimensional data space that captures the maximal amount of variance in the data.
Big dimensional data bad, lesser dimensions good:)
Perspectives
We can think about PCA from two viewpoints
Maximizing the variance of projected data
Minimizing reconstruction error
Huh? What’s variance? Covariance?
Let’s nail down expected value first.
The expected value of a random variable, which represents its theoretical mean or center of mass. For a continuous random variable with probability density function (PDF) , the expected value is:
So, as you can probably gauge, this is like the mean – describes the central tendency of a distribution. But, it does not tell us anything about its spread / dispersion. This is where we get variance!
The variance of a random variable , denoted or , is the expected value of the squared deviation from its mean .
The square root of the variance, , is the standard deviation, which is returned to the original units of the variable and is often more interpretable.
Takeaway – A low variance indicates that the values are tightly clustered around the mean, while a high variance indicates that they are spread out over a wider range.
Some math-y aspects of variance
The Raw-score Formula
The definition of variance can be expanded using the linearity of expectation.
This is more convenient for us. Why?
Empirally determining variance
In practice, we do not have the true distribution but a finite dataset of observations . We estimate the true variance using the empirical variance (or sample variance). First, the empirical mean is calculated:
The empirical variance is the average of the squared deviations from this empirical mean:
Important note – The unbiased estimator uses a denominator of , but for large and in many machine learning contexts, the version with is used.
Huh? You ask again.
Why did you talk about above?
First – an unbiased estimator is a formula that, on average, gives us the correct value for the property that we are trying to measure from a population.
The population bit is important – this is the actual disribution. What are have are samples!
When you calculate the variance of a sample, you don’t know the true mean () of the entire population. Instead, you have to use the sample mean ().
The sample mean () is calculated from your specific data points. By its nature, it’s the value that is closest to all the points in your sample, minimizing the sum of squared differences for that particular sample.
Since the sample mean is always a “perfect fit” for the sample, the deviations from it are slightly smaller than the deviations would be from the true population mean! So, we divide by to account for this – we call this Bessel’s Correction.
Using a smaller denominator makes the final result slightly larger. This small increase perfectly corrects for the underestimation caused by using the sample mean, ensuring that, on average, the calculated variance matches the true population variance. This is why it’s called the unbiased estimator. (What’s this? Keep reading until a few more sections. Or hit ctrl+F and find biased-estimator-def)
Ok, but, why ???
(Feel free to skip this bit if you don’t care about Math. But, then, that’s why you are here, isn’t it?)
First, let’s define our terms:
is the true variance of the population (what we want to estimate).
is the true mean of the population.
is the sample mean.
The sample variance estimator is .
The expectation operator, , gives the long-run average of an estimator. For an estimator to be unbiased, its expectation must equal the true parameter, i.e., .
Now, the derivation!
Our goal is to compute the expected value of the sum of squared differences, . We start by rewriting the term inside the sum:
Expanding the squared term gives:
Distributing the summation:
Now, let’s simplify the middle term, , which equals . Substituting this in:
Now we take the expectation of this entire expression:
By definition, is the population variance , and is the variance of the sample mean, which is . Substituting these in:
See? Now remember that you can user either or since for very, very large, .
Covariance!
Variance describes how a single variable changes. Covariance extends this idea to describe how two variables change together.
The covariance between two random variables and with means and respectively, is the expected value of the product of their deviations from their means:
Covariance Matrix!!
Multidimensional Data
For a -dimensional random vector with mean vector , the relationships between all pairs of its components are captured by the covariance matrix.
The entry at position of this matrix is the covariance between the -th and -th components of the vector:
The diagonal elements are the variances of each component, .
As always, properties! 1. Symmetry:, since . 2. Positive Semi-Definiteness: For any vector , . This is because , and variance is always non-negative! (since it’s a square, duh)
Empirical Covariance Matrix
As always, we only have a sample; not the distribution / population.
So, what do we do? or ?
I will first define population and samples since I’ve just been naming them
Population: The entire set of all possible observations of interest. Population parameters, such as the true mean and the true covariance , are considered fixed but unknown constants.
Sample: A finite subset of observations $latex {\mathbf{x}n}{n=1}^N$ drawn from the population. We use the sample to make inferences about the unknown population parameters.
With me so far? Good, now more definitions.
An estimator is a function of the sample data that is used to estimate an unknown population parameter. For example, the sample mean is an estimator for the population mean . A crucial property of an estimator is its bias.
Definition (Bias of an Estimator): Let be an unknown population parameter and let be an estimator of based on a sample. The bias of the estimator is defined as the difference between the expected value of the estimator and the true value of the parameter:
An estimator is unbiased if its bias is zero, i.e., . This means that if we were to repeatedly draw samples of size from the population and compute the estimate for each, the average of these estimates would converge to the true parameter .
An estimator is biased if .
(See? I told you a few more sections earlier; keyword: biased-estimator-def)
Cool, I just want to remind you of Bessel’s Correction once again:
and also the why once again – The bias arises because we are measuring deviations from the sample mean , which is itself derived from the data.
The data points are, on average, closer to their own sample mean than to the true population mean, leading to an underestimation of the true spread.
First, the MLE!
Maximum Likelihood Estimation is a fundamental method for deriving estimators. Given a dataset and a parameterized probability model , the likelihood function is the probability of observing the data, viewed as a function of the parameters :
The MLE principle states that we should choose the parameters that maximize this likelihood function. For an i.i.d. sample, this is equivalent to maximizing the log-likelihood:
How did we get the above? Take log on both sides of
Ok what the hell is this? Probability theory solves the “forward problem”: Given a model with known parameters, what does the data look like? (e.g., “If this coin is fair, , I expect to see roughly 5 heads in 10 flips.”)
(Statistical inference in general, and) MLE in particular, solves the inverse problem: Given the data we have observed, what were the most likely parameters of the model that generated it? (e.g., “I flipped a coin 10 times and got 8 heads. What is the most plausible value for this coin’s bias, $\theta$?”)
Normally, we think of as a probability distribution over possible datasets , for a fixed parameter setting .
The likelihood function, , treats the observed data as fixed and views this quantity as a function of the parameters.
Here, I present a statement:
The covariance estimator with denominator is the MLE under a Gaussian assumption
Ponder this. What can it even mean? Yeah, it’s just that is taken as a gaussian.
Specifically, we assume our data points are drawn i.i.d. from a multivariate Gaussian distribution, . The parameters to be estimated are .
That means that the log-likelihood function for this model and a dataset is:
Do math, take partial derivatives, yada yada and we get:
(the sample mean)
Takeaway – The MLE (estimator / estimation – same thing) is the estimator that makes the observed data “most probable” under a Gaussian model.
Now, this estimator is biased!
Changing notation a bit (I started this on another day and am lazy to keep track, haha).
Here’s what’s up rn:
The estimator for the covariance matrix using denominator is the MLE:
Its expected value is: (tiny recap time!)
This estimator is biased. The unbiased sample covariance matrix is:
Its expected value is .
Now, which one do we use?
Use MLE for ML, unbiased for statistics.
Statistics: Unbiasedness is a highly desirable property. An unbiased estimator is correct on average.
The unbiased estimator is the standard. In statistical analysis (e.g., hypothesis testing, confidence intervals), using an unbiased estimate of variance is critical for the validity of the statistical procedures. The focus is on estimation accuracy.
Machine Learning: Minimizing prediction error is a desired property. MLE is better for such cases.
The quality of an estimator is often judged by its Mean Squared Error (MSE)
This is the bias-variance tradeoff. The best estimator is one that minimizes this total error.
The MLE estimator has a slightly lower variance than the unbiased estimator (what, you want the proof? we did this earlier, dummy). It can be shown that . Therefore, if the goal is to find an estimator that is “closer” to the true value on average in terms of squared error, the biased MLE is superior.
Back to PCA
We take the empirical covariance matrix to be
where is the data matrix with observations as rows. This is when we are dealing with a centered dataset, i.e., the sample mean, .
Notice that the covariance matrix, ; it is reflects the dimenions, NOT the samples.
Important Note: Ok, cool, for ML (explained above). But, does it matter here? NO. We use eigenvectors and these are the same for both and since these are only scaled versions of each other.
(Perspective 1) As maximising variance
Remember: We have centered the dataset!
Now, we are trying to find a lower dimension space. So, we reduce the number of dimensions (duh), but what this means is that we should be able to reflect in less than coordinate vectors.
So, we try to find a set of coordinate vectors such that the number of these coordinate vectors is less than . Thus, now, the new set of coordinate vectors will no longer span the entire real space, i.e., .
Now, let us find the direction, represented by a unit vector , onto which the projected data has the greatest variance.
The projection of a data point onto the direction results in a scalar coordinate . The variance of these projected coordinates over the entire dataset is:
What we want to do is maximize this variance subject to the constraint that is a unit vector, i.e., . This is a constrained optimization problem:
We form the Lagrangian:
Setting the gradient with respect to to zero yields:
This is the eigenvalue equation for the covariance matrix . To maximize the variance , we must choose to be the largest eigenvalue of . The corresponding vector is the first principal component.
Subsequent principal components are found by finding the eigenvectors of corresponding to the next largest eigenvalues, ensuring they are orthogonal to the preceding components.
Notice how it is also very neat that the variance is then just the sum of the chosen eigen values:)
(Perspective 2) As minimizing reconstruction error
No one really talks about this one much but let’s see. I will be very math-y here.
Let the principal subspace be an -dimensional subspace spanned by an orthonormal basis of vectors
.
The orthogonal projection of a data point onto this subspace is .
Our goal is to find the basis that minimizes the average squared reconstruction error:
By the properties of orthogonal projections, the total variance can be decomposed: . Since the total variance is fixed, minimizing the reconstruction error is equivalent to maximizing the projected variance .
So, yes, we have very smartly reduced the 2nd perspective to the first perspective. Yay!
Probabilistic PCA (PPCA)
Classical PCA is a geometric, algorithmic procedure. Probabilistic PCA (PPCA) reformulates this procedure within a probabilistic framework by defining a latent variable model that describes the generative process of the data.
What? Ok, fine, I’ll explain.
PCA is a point estimate – gives you a single, definitive answer for the principal components and the lower-dimensional space they define, without expressing any uncertainty about that result. It is fundamentally a descriptive tool, not a generative one. This means:
It cannot generate new data points
It does not provide a likelihood of the data, making principled model selection (e.g., choosing the optimal number of components ) difficult!
It cannot handle missing values in the data.
So, we now have PPCA! PPCA posits that the high-dimensional observed data is a manifestation of some simpler, unobserved (latent) cause, where .
PPCA models the relationship between the latent and the observed (this is such a smart sounding statement, omg).
Definitions
(No, what did you expect?)
Latent Variable Prior: A simple cause is assumed for each data point. This is modeled by a prior distribution over the latent variable . PPCA assumes a standard multivariate Gaussian prior:
This asserts that the latent variables are, a priori, independent and centered at the origin of the latent space.
Conditional Distribution of Data (Likelihood): The observed data point is generated from its corresponding latent variable via a linear transformation, with added noise. This is defined by the conditional probability :
This is equivalent to the equation , where:
is a matrix that maps the latent space to the data space. Its columns can be interpreted as the basis vectors of the principal subspace.
The principal subspace is the lower-dimensional plane or hyperplane that captures the most important variations in your data. Basis vectors are the fundamental directions that define or “span” that subspace.
This just means that the reconstructed data point is made by a linear combination of the basis vectors of the principal subspace (plus the following things).
is the mean of the data.
Yeah I don’t think I can explain this more.
is isotropic Gaussian noise, which accounts for the variability of data off the principal subspace.
isotropic = fluctuations are same in all directions; hence the scalar multiplied with the identity matrix for variance.
Also, every dimension is independent and uncorrrelated.
Calculation time!
To define the likelihood of the model, we must integrate out the latent variables to find the marginal distribution of the observed data, :
Since both and are Gaussian, and the relationship is linear, this integral can be solved analytically. The resulting marginal distribution is also a Gaussian, , with mean and covariance:
Mean:.
Covariance:.
The parameters of the model () are found by maximizing the log-likelihood of the observed data under this marginal distribution. How to do this? I dunno and I can’t write that much latex. Go read a book for this please (note to self – code is available thankfully).
Advantanges
Handling Missing Data: The generative nature of PPCA allows it to handle missing data through the Expectation-Maximization (EM) algorithm.
How? Again, I think I’ll write more on EM later. But, for now, let’s take it as is.
Model Selection: The probabilistic formulation provides a log-likelihood value for the dataset given a model.
This allows for principled model selection, for instance, choosing the optimal number of principal components $M$ by comparing the likelihood values (often using criteria like AIC or BIC) for different choices of $M$.
PPCA is used in robotics for sensor fusion and state estimation where sensor noise is a critical factor. How? Idk – I took this statement as is. Takeaway – super useful.
Kernel PCA
This addresses the primary limitation of standard PCA – PCA seeks a linear subspace to represent the data. If the data lies on a complex, non-linear manifold (e.g., a spiral, a “Swiss roll”), any linear projection will fail to capture the underlying structure, leading to a poor low-dimensional representation.
How? Map the data from the original input space to a higher (often infinite) dimensional feature space via a non-linear mapping . The mapping is chosen such that the structure of the mapped data becomes linear in . Standard linear PCA is then performed on the data in this feature space.
But, we get a computational barrier:
The dimensionality of can be enormous or infinite.
The function itself may not even be known explicitly.
So, we use the kernel trick!
Let’s perform PCA on the mapped data $latex {\phi(\mathbf{x}n)}{n=1}^N$. The covariance matrix in the feature space is:
The eigenvalue problem in is , where are the principal components in the feature space.
Want to go on? Follow this lecture pdf from slide 32; I really can’t write it better for myself either. The only extra thing that I can offer is to answer the question: Why can eigenvectors be written as linear combiunation of features?
The eigenvectors vⱼ can be written as a linear combination of the features because they must lie in the space spanned by the feature vectors φ(xᵢ) themselves.
Let’s start with the PCA equation:
We can isolate the eigenvector vⱼ by rearranging the equation (assuming the eigenvalue λⱼ is not zero):
Now, let’s group the terms differently:
Notice that the term in the parenthesis, , is just a scalar (a single number) because it’s a dot product divided by constants.
If we call this scalar coefficient , we get the exact relationship shown on the slide:
This proves that any eigenvector vⱼ is simply a weighted sum of all the feature vectors φ(xᵢ).
Spectral Clustering
This is a graph-based clustering technique that partitions data by analyzing the spectrum (eigenvalues) of a graph’s Laplacian matrix.
Foundations
What? Ok, some definitions :sparkles: (I hope you can relate to some things if you took data structures and algorithms)
Similarity Graph
Given a dataset of points , we construct a graph , where the set of vertices corresponds to the data points. The set of edges represents the similarity or affinity between pairs of points. This similarity is quantified by a weighted adjacency matrix, where is the similarity between points and . High values indicate high similarity.
Common ways to construct include the k-nearest neighbor graph or using a Gaussian kernel: .
Graph Partitioning
The goal of clustering is to partition the vertices into disjoint sets (clusters) . An ideal partition is one where the edges within a cluster have high weights (high intra-cluster similarity) and the edges between clusters have low weights (low inter-cluster similarity). This is known as finding a minimal graph cut.
This is our objective btw in case it wasn’t clear.
Graph Laplacian
Ok, this isn’t much of a definition. I’ll try to explain it since it’s the core component / concept.
It is the fundamental object whose spectrum (eigenvalues and eigenvectors) reveals the cluster structure of the graph.
First, let’s define the degree matrix. A diagonal matrix where each diagonal element is the sum of weights of all edges connected to vertex :
The unnormalized graph laplacian is:
Some properties of the Graph Laplacian:
It is symmetric and positive semi-definite.
It is symmetric since it’s the combination of the adjacency matrix and the degree matrix (a diagonal matrix) are symmetric.
We later show that turns into a square term, so it is positive semi-definite (or semi positive definite). Or, ctrl + F and find quadratic-laplacian-square.
The Spectral Theorem states that any real, symmetric matrix has real eigenvalues and orthogonal eigenvectors.
The added property of being positive semi-definite ensures these real eigenvalues are also non-negative (λ≥0).
This is crucial because it allows us to reliably sort the eigenvalues from smallest to largest.
The smallest eigenvalue of is always , with the corresponding eigenvector being the vector of all ones, .
This is because the sum of each row in the Laplacian matrix is always zero by construction ().
Graph cut and Laplacian
Ok, simplest case first – we have two partitions, i.e., two disjoint sets, and its complement .
The “cut” is the sum of weights of all edges connecting these two sets:
Repeating for dramatic effect – minimizing this cut directly is an NP-hard combinatorial problem.
We (I) define a partition indicator vector where:
Yeah, I didn’t want to write latex.
Now, consider the quadratic form of the Laplacian, .
See? I promised you a square earlier! (keyword – quadratic-laplacian-square)
Now, observe the term :
If (i.e., both nodes are in the same partition), .
If (i.e., nodes are in different partitions), .
So / Therefore / Thus / Hence, minimizing the graph cut is equivalent to minimizing .
How does this help us?
The optimization problem with the constraint that is still combinatorial.
So, what we do is – we relax. With multiple xs. The entries of can take any real values now. So, we get
This is the formulation for minimizing the Rayleigh quotient. Its solution? Notice how its the same optimization problem we had in PCA?
The solution is given by the eigenvector of corresponding to the smallest eigenvalue.
However, the smallest eigenvalue is with eigenvector . This is a trivial solution where all entries of are constant, which does not define a partition.
So, the non-trivial solution must be orthogonal to this vector of ones.
subject to and
This is the eigenvector corresponding to the second-smallest eigenvalue of .
This eigenvector is known as the Fiedler vector.
Generalized
(I’m just going to get an LLM to generate it)
Construct Similarity Graph: Given data points, construct the adjacency matrix .
Compute Laplacian: Compute the degree matrix and the Laplacian .
Compute Eigenvectors: Find the first eigenvectors of corresponding to the smallest eigenvalues.
Form Embedding: Construct a matrix with these eigenvectors as its columns.
Cluster Embedding: Treat each row of as a new data point in a -dimensional space. Cluster these new points into clusters using a simple algorithm like k-means.
Assign Original Points: The cluster assignment of the -th row of is the final cluster assignment for the original data point .
Remember kernel PCA? The one that solves the problem of PCA being linear? Yeah, t-SNE solves the same thing.
Prerequisites
Gaussians
The bell curve, duh. I am not explaining this further. Here’s the formula:
The important thing to know here is that Gaussians have light tails.
Values away from the mean are exceptionally unlikely.
t-distribution
These have heavier tails than Gaussians – defined by degrees of freedom ().
The PDF of the t-distribution decays polynomially, not exponentially.
As , the t-distribution converges to the Gaussian distribution.
The specific case used in t-SNE is the t-distribution with one degree of freedom (), also known as the Cauchy distribution. Its simplified PDF has the form:
Now, before moving on, I want to add a bit more context – the teacher is the gaussian and the student is the t-distribution (the lower dimension one).
This is a crucial design choice to solve the “crowding problem”. In a 2D map, there isn’t enough space to accurately represent all the neighborhood distances from a high-D space. The heavy tails of the t-distribution mean that two points can be placed far apart in the map and still have a non-trivial similarity score. This allows t-SNE to place moderately dissimilar points far apart, effectively creating more space for the local neighborhoods to be modeled without being “crowded” together.
Kullback-Leibler (KL) Divergence
It is a measure of how one probability distribution, , is different from a second, reference probability distribution, . It is not a true distance metric (it is not symmetric), but it is often used to measure the “distance” or “divergence” between distributions.
For discrete distributions over outcomes :
Again, context – this is our cost function in t-SNE.
Oh? You want more on it? I want to cover both KL divergence and Gaussians more. But, for now, I think I can suggest Wikipedia.
Math
Three stages:
Stage 1: Modeling High-Dimensional Similarities
The similarity between two data points, and , is converted into a conditional probability, . This is interpreted as the probability that would choose as its neighbor if neighbors were picked in proportion to their probability density under a Gaussian distribution centered at .
So, sorta like “j given i” but not exactly.
Ok, what is ? Variance of the local Gaussian. Yes, but how do we get this? We use something called Perplexity
Perplexity
(adding this as well – notice how it dictates the size of the neighbourhood in a way)
Yeah, you see how? (I just added the last sentence within brackets for fun)
Now, notice how the scale parameter must be locally adaptive. Each data point needs its own unique bandwidth that is appropriate for its local neighborhood density.
Before everything else, focus on the following definition.
For each data point , we have a conditional probability distribution over all other points, where . The Shannon entropy of this distribution, measured in bits, is:
The entropy quantifies the uncertainty involved in choosing a neighbor for point according to the distribution .
If the distribution is sharply peaked on one neighbor (low uncertainty), the entropy will be low.
If the distribution is spread out over many neighbors (high uncertainty), the entropy will be high.
The perplexity of the distribution is defined as the exponential of its Shannon entropy:
(If you’ve done NLP, this would seem very familiar. That’s because it is.)
What does this do? Notice that if the probability distribution $P_i$ is uniform over $k$ neighbors (and zero for all others), its perplexity will be exactly $k$.
Perplexity can be interpreted as a smooth, continuous measure of the effective number of neighbors for point .
Ok, now, we don’t know – wouldn’t we need the variances to calculate it?
Yes. So, here’s what we do:
User Input: The user specifies a single, global perplexity value. This value is the same for all points and typically ranges from 5 to 50. Let’s say the user chooses a perplexity of 30.
Per-Point Optimization: For each data point, the t-SNE algorithm performs an independent optimization. It searches for the specific value of the Gaussian variance, , that produces a conditional probability distribution whose perplexity is exactly equal to the user’s desired value (in this case, 30).
The Search Algorithm: This search is performed efficiently using binary search. The algorithm makes a guess for , computes the resulting perplexity, and then adjusts up or down until the target perplexity is met within a given tolerance.
Neat, isn’t it?
Last thing in this stage – Symmetrization.
The conditional probabilities are not symmetric. To create a single joint probability distribution over all pairs of points, they are symmetrized:
where is the number of data points. This represents the target similarity structure that we wish to preserve.
Stage 2: Modeling Low-Dimensional Similarities ()
Now, we define a similar probability distribution for the points in the low-dimensional embedding space, .
Remember how I told you about the crowding problem? No? Go back.
The t-distribution is heavy-tailed, meaning it decays much more slowly with distance than a Gaussian.
This is the student’s t-distribution with one degree of freedom.
Stage 3: Optimization via KL Divergence Minimization
We minimize the KL divergence:
If you are a dum-dum like me – gives half of what does.
This is non-convex: has multiple minimas. So, we use iterative gradient descent and hope for the best.
(This makes t-SNE non-deterministic!)
Why not just kernel PCA?
Kernel PCA: finds an optimal linear projection in a non-linearly transformed space.
Non-linear feature extraction and dimensionality reduction. It seeks to find a set of non-linear components that can be used for subsequent tasks (e.g., classification, regression).
t-SNE: finds a a faithful representation of the local data topology.
Visualization and exploratory data analysis. It seeks to create a 2D or 3D map of the data that reveals its underlying local structure and clustering.
Now, a very, very important point is that
Kernel PCA deals with global structure, t-SNE with local.
You use kernel PCA when you need non-linear feature extraction for a subsequent machine learning task.
You use t-SNE for visualizing / exploring a high-dimensional feature space.
Key takeaway: Do NOT use t-SNE for feature extraction.
There are basically 5 (ಐದು / पाँच) types of matrix decompositions that are like super important. I strive to go in depth into all of them. These are
Eigendecomposition (This post!)
QR decomposition
Cholesky decomposition
LU decomposition
(perhaps the most important) Singular Value Decomposition
Edit (July 20, 2025): Added proof of spectral theorem.
Why do I write this?
I wanted to create an authoritative document I could refer to for later. Thought that I might as well make it public (build in public, serve society and that sort of stuff).
Eigen decomposition
Wait…
Basics!
Linear Transformation
A linear transformation is a function between two vector spaces and that preserves the operations of vector addition and scalar multiplication. For finite-dimensional vector spaces, any linear transformation can be represented by an matrix . The action of the transformation on a vector is given by matrix-vector multiplication:.
Ok, got it? Basic linear algebra.
Eigenvectors and eigenvalues
Let be a square matrix. A nonzero vector is an eigenvector of if there exists a scalar such that . The scalar is called the eigenvalue corresponding to the eigenvector .
I will now add a bit of geometry. The equation states that the vector (the result of the transformation) is collinear (fancy term for along the same line) with the original vector . The eigenvalue is the scaling factor.
If , the eigenvector is stretched.
If , the eigenvector is compressed.
If , the eigenvector is flipped and scaled.
If , the eigenvector is unchanged.
If , the eigenvector is mapped to the zero vector, meaning it lies in the null space of .
Want a reminder on how to find these? The expression is a polynomial in of degree , called the characteristic polynomial. The roots of this polynomial are the eigenvalues of . By the fundamental theorem of algebra, an -degree polynomial has roots (counting multiplicity) in the complex plane .
Important matrix types
Ok, this is purely LLM generated.
Diagonal Matrices (): Square matrices where all non-diagonal entries are zero ( for ). They represent pure scaling along the coordinate axes. Their powers () and inverses () are trivial to compute.
Triangular Matrices (): Square matrices that are either lower triangular (, where for ) or upper triangular (, where for ). Systems of equations involving triangular matrices can be solved efficiently via forward or backward substitution.
Orthogonal Matrices (): Square matrices whose columns (and rows) form an orthonormal basis. They satisfy the property , which implies . Geometrically, orthogonal matrices represent pure rotations or reflections, which preserve lengths and angles of vectors: .
I wrote this (!!) –
Also, Diagonalizability. A square matrix is said to be diagonalizable if it has linearly independent eigenvectors. Such matrices are also known as non-defective matrices.
Eigendecomposition
Basics
Ok, we can start now. For eigen decompositions, we are super concerned with endomorphisms. This is when the domain and the codomains of the linear transformation are in the same space. This is basically – , represented by a square matrix .
Why do you need to know this? You don’t. I knew this and barfed the information on you.
When can you eigendecompose?
If a matrix is diagonalizable, it can be factored as , where:
is a matrix whose columns are the linearly independent eigenvectors of , i.e., .
is a diagonal matrix whose diagonal entries are the corresponding eigenvalues, .
is the inverse of the matrix . The existence of is guaranteed by the linear independence of the eigenvectors.
Ok, why can you eigendecompose?
Let have linearly independent eigenvectors with corresponding eigenvalues . We can write the eigenvalue equations as:
We can concatenate these equations into a single matrix equation. Let . Then:
The right-hand side can be expressed as the product of and a diagonal matrix :
Thus, we have the relationship . Since the eigenvectors are linearly independent, the matrix is invertible. We can right-multiply by to obtain the eigendecomposition:
Side Note: Notice how is not orthonormal. It can be, sure. Your call. Why? It’s inverse removes the norm of the individual columns. Trivial enough (math textbook, much?).
Eigendecomposition is powerful!
Eigendecomposition reveals fundamental properties of a matrix:
Determinant: The determinant of is the product of its eigenvalues.
Trace: The trace of is the sum of its eigenvalues.
Matrix Powers: Eigendecomposition simplifies the computation of matrix powers.
The Spectral Theorem for Symmetric Matrices
Ok, here’s a special case – what if the matrix is symmetric? (Why do we care about symmetric matrices? Remind yourself about covariance matrices.)
Theorem (Spectral Theorem): For any real symmetric matrix :
All eigenvalues of are real numbers.
There exists an orthonormal basis of consisting of the eigenvectors of . That is, the eigenvectors can be chosen to be mutually orthogonal and have unit norm.
Proof 1: Eigenvalues are Real
Let be an eigenvalue of with a corresponding eigenvector . These may be complex, so we start with the standard eigenvalue equation:
Now, take the conjugate transpose (denoted by a star, ) of both sides:
Since the matrix is real and symmetric, its conjugate transpose is itself (). This simplifies the equation to:
Next, we right-multiply this equation by the original eigenvector :
Now, let’s return to the original equation, , and left-multiply it by :
By comparing Eq. 1 and Eq. 2, we can see that:
The term is the squared magnitude of the vector . Since an eigenvector cannot be a zero vector, must be a positive real number. Therefore, we can safely divide by it, leaving:
A number is equal to its own complex conjugate if and only if it is a real number. This completes the proof that all eigenvalues of a real symmetric matrix are real.
Proof 2: Eigenvectors of Distinct Eigenvalues are Orthogonal
Let and be two distinct eigenvalues () of , with corresponding eigenvectors and . We have:
Let’s start with the first equation and left-multiply by :
Now, let’s take the transpose of the entire expression. Since the result is a scalar, it is equal to its own transpose:
Because is symmetric (), this becomes:
Next, we return to the second original equation () and left-multiply by :
By comparing Eq. 3 and Eq. 4, we get:
We started with the assumption that the eigenvalues are distinct, so . For the product to be zero, the other term must be zero:
This shows that the eigenvectors and are orthogonal.
Yeah, that’s it.
Cool, now think about eigendecomposition. is suddenly an orthogonal matrix. Thus, for any real symmetric matrix , its eigendecomposition is:
This form has a powerful geometric interpretation: any transformation by a symmetric matrix can be understood as a sequence of three operations:
A rotation back to the original coordinate system ().
A rotation or reflection () to align the coordinate system with the eigenvectors.
A scaling along these new axes by the eigenvalues (multiplication by ).
“Huh?”, you ask. Yeah, the above order is wrong.
When you apply the transformation to a vector , you calculate . The correct sequence of geometric operations is:
Rotation/Reflection (): Aligns the coordinate system with the eigenvectors. This is essentially a change of basis.
Scaling (): Scales the vector along these new axes.
Rotation Back (): Returns to the original coordinate system.
Cool, ok, but where do I use it?
I point you back to the “Eigendecomposition is powerful!” subsection.
Evidently, progress in the stuff I could teach was slow owing to academics (ironic, isn’t it?). Regardless, they are still interested in RRC and a couple of them got part-time internships in a robotics startup (Yay!).
PyTorch
Not just the basics but also dive into critical aspects that will be essential for applying neural networks to robotics problems.
You have done quite a bit of this in the mathy bits earlier and will redo it in the mobile robotics course. Take a look again at this in for the time being: Intro to Optimization
Essentially, I, along with a collaborator (Mitansh K), did the following –
Localized Implementation: Implemented pretty much everything that’s offered by the Google File System inclusing
Write
Read
Replication
Record Append
Re-Replication
Stale Replica Handling
Garbage Collection
Operation Log
Data Integrity
using a codebase of 7200 LOC in Go. Evidently, we missed out on snapshoting and directory management and have left them as to-dos.
Enhanced Consistency: Rather than the at-least once record append operations offered by the GFS, we implemented it to be exactly once. This was done using a modified version of the 2PC protocol and handling idempotency (do see our report!).
Comprehensive System Analysis: Validated system performance through extensive benchmarking, demonstrating near-linear scaling in throughput for reads, writes, and appends, while maintaining consistency and reliability.
The implementation could be found here and the report here.
Any thoughts/improvements (especially on the GitHub issues) would be welcome.


.
, then its complement
is also in
is a countable sequence of events in


for
), the probability of their union is the sum of their individual probabilities.

is a function
that assigns a real number to every possible outcome
are valid events in


![[a, b]](https://s0.wp.com/latex.php?latex=%5Ba%2C+b%5D&bg=ffffff&fg=000&s=0&c=20201002)


occurring, given that event
has already occurred, is denoted
. It represents an update to our belief about


): A proposition about the world whose truth we are uncertain about (e.g., “The patient has the disease,” “This email is spam”).
): A new piece of data or observation that is relevant to the hypothesis.
): Our initial belief in the hypothesis before observing the evidence.
): The probability of observing the evidence if the hypothesis were true. This is the forward, generative model.
): Our updated belief in the hypothesis after observing the evidence. This is the quantity we want to compute.
, is the total probability of observing the evidence, averaged over all possible hypotheses. It is computed using the law of total probability:
. It acts as a normalization constant, ensuring that the posterior probabilities sum to one.


![\mathbb{E}[g(X)] = \sum_{x} g(x) \, p(x) \quad \text{or} \quad \int_{-\infty}^{\infty} g(x) \, f(x) dx](https://s0.wp.com/latex.php?latex=%5Cmathbb%7BE%7D%5Bg%28X%29%5D+%3D+%5Csum_%7Bx%7D+g%28x%29+%5C%2C+p%28x%29+%5Cquad+%5Ctext%7Bor%7D+%5Cquad+%5Cint_%7B-%5Cinfty%7D%5E%7B%5Cinfty%7D+g%28x%29+%5C%2C+f%28x%29+dx&bg=ffffff&fg=000&s=0&c=20201002)


![\mu'_k = \mathbb{E}[X^k]](https://s0.wp.com/latex.php?latex=%5Cmu%27_k+%3D+%5Cmathbb%7BE%7D%5BX%5Ek%5D&bg=ffffff&fg=000&s=0&c=20201002)
![\mu'_1 = \mathbb{E}[X]](https://s0.wp.com/latex.php?latex=%5Cmu%27_1+%3D+%5Cmathbb%7BE%7D%5BX%5D&bg=ffffff&fg=000&s=0&c=20201002)

![\mu_k = \mathbb{E}[(X - \mu)^k]](https://s0.wp.com/latex.php?latex=%5Cmu_k+%3D+%5Cmathbb%7BE%7D%5B%28X+-+%5Cmu%29%5Ek%5D&bg=ffffff&fg=000&s=0&c=20201002)
.
, is the variance. It is the most important measure of the spread or dispersion of the distribution. It is denoted
or
. The standard deviation,
, is the square root of the variance, returned to the original units of the variable.
–
: Perfect positive linear relationship.
: Perfect negative linear relationship.
: No linear relationship (uncorrelated).


is going (it converges to
). The CLT tells us how it gets there: it describes the shape of the probability distribution of the sample mean around the true mean for a large but finite
be a sequence of i.i.d. random variables with finite mean


. Whether the individual variables are from a uniform, Bernoulli, exponential, or any other well-behaved distribution, the distribution of their average will always tend towards a Gaussian bell curve.
 must preserve the norm of vectors
 , the inner product preservation property is
  . This expands to
  .
.
 .
. .
.  rotation matrices forms a mathematical group under matrix multiplication. This group is known as the Special Orthogonal Group, denoted
  .
.  represents rotations in the plane, and
  represents rotations in 3D space.
![\mathbf{e}_1=[1,0]^\top, \mathbf{e}_2=[0,1]^\top](https://s0.wp.com/latex.php?latex=%5Cmathbf%7Be%7D_1%3D%5B1%2C0%5D%5E%5Ctop%2C+%5Cmathbf%7Be%7D_2%3D%5B0%2C1%5D%5E%5Ctop&bg=ffffff&fg=000&s=0&c=20201002) completely defines the transformation. A counter-clockwise rotation by an angle
completely defines the transformation. A counter-clockwise rotation by an angle  maps
maps ![\mathbf{e}_1 \mapsto [\cos\theta, \sin\theta]^\top](https://s0.wp.com/latex.php?latex=%5Cmathbf%7Be%7D_1+%5Cmapsto+%5B%5Ccos%5Ctheta%2C+%5Csin%5Ctheta%5D%5E%5Ctop&bg=ffffff&fg=000&s=0&c=20201002) and
and ![\mathbf{e}_2 \mapsto [-\sin\theta, \cos\theta]^\top](https://s0.wp.com/latex.php?latex=%5Cmathbf%7Be%7D_2+%5Cmapsto+%5B-%5Csin%5Ctheta%2C+%5Ccos%5Ctheta%5D%5E%5Ctop&bg=ffffff&fg=000&s=0&c=20201002) . The columns of the rotation matrix are these transformed basis vectors, yielding:
. The columns of the rotation matrix are these transformed basis vectors, yielding:


 ) is not a mathematical inconvenience; it is the essential property that allows matrices to capture the non-commutative nature of 3D rotations. The choice of whether to pre-multiply (
 ) or post-multiply (
 ) depends entirely on the coordinate frame in which the new rotation is defined!
 , is a coordinate system used to represent the position and orientation of objects. In
  , it consists of an origin point and a set of
  orthonormal basis vectors.
 expressed in frame
  .
.
 times the old coordinates.
 .
.
 , is pre-multiplied (multiplied on the left) to the existing rotation matrix,
  . The order of matrix multiplication (
 .
. .
. . This local rotation transforms frame
  , and is denoted
  . We want to find the final orientation of the object,
  , in the global frame.
 is the orientation of
 and
and  , the final orientation is:


 ) with respect to the base (frame
  ) is the post-multiplication of the successive joint rotations:
 ): Ordered, commutative, associative. Lacks algebraic closure (e.g.,
  has no real solution).
 ): Adds the imaginary unit
  where
where  . The system is algebraically closed, commutative, and associative. It sacrifices the property of being an ordered field.
 ): Adds two more imaginary units,
  and
and  ). This non-commutativity is not a flaw; it is the essential feature that allows quaternions to model non-commutative 3D rotations.
 ): Adds four more units. The system is neither commutative nor associative, sacrificing associativity in multiplication (
 ).
). is an element of the form:
 are real numbers, and
  form a basis for this 4D vector space.
 is the scalar part, denoted
  .
. is the vector part, denoted
  . A quaternion with a zero scalar part is called a pure quaternion.

 and
and  is defined by distributing terms and applying these rules. This leads to a more compact formula relating quaternion multiplication to the vector dot and cross products:
 . The conjugate of a product is the reversed product of the conjugates:
  .
. , is a non-negative real number defined as:
 . The norm is multiplicative:
  .
. is:
is:
 . For unit quaternions, the inverse is simply the conjugate:
  . The set of all unit quaternions forms a 3-dimensional sphere (
 ) embedded in
  is uniquely defined by an axis of rotation (a unit vector
  ) and a right-handed angle of rotation
  .
.
 about any axis corresponds to
  , and
, and is required to return to the identity quaternion
  .
. or
or  correspond to the exact same physical rotation in 3D space.
 into the quaternion algebra by representing it as a pure quaternion
  :
:

 is guaranteed to be another pure quaternion. The vector part of
  .
. is followed by a rotation represented by
  , the single composite rotation is represented by the quaternion product:
 ) correctly reflects the non-commutativity of 3D rotations (e.g., rotating 90 degrees about the x-axis then the y-axis is different from the reverse).
![t \in [0,1]](https://s0.wp.com/latex.php?latex=t+%5Cin+%5B0%2C1%5D&bg=ffffff&fg=000&s=0&c=20201002) is the interpolation parameter and
is the interpolation parameter and  .
.  , and an operation of vector addition that acts on points. This operation,
  , satisfies the following axioms:
 ,
,  .
. ,
,  .
. , there exists a unique vector
  such that
  . This unique vector is denoted
  .
. of an affine space
  that is a vector subspace of
 is a support point (an origin for the subspace) and
  is the direction space. A vector space is a special case of an affine subspace where the support point is the origin.
 , then any point
 ) and planes (
 ). A hyperplane is an affine subspace of codimension 1 (i.e., of dimension
  in an
in an  between two affine spaces is a function that preserves the structure of affine subspaces. It can be shown that any affine map can be uniquely decomposed into a linear map on the underlying vector spaces plus a translation. In a coordinate system, this takes the familiar form:
 is the matrix of the underlying linear map and
  is a translation vector.
 -dimensional feature space, the hyperplane is defined by the set of points
  satisfying the equation:
 is the normal vector that defines the direction space’s orthogonal complement, and
  is a scalar related to the translation from the origin.
 . It satisfies the axioms of an inner product: bilinearity, symmetry, and positive definiteness.
![f: [a,b] \to \mathbb{R}](https://s0.wp.com/latex.php?latex=f%3A+%5Ba%2Cb%5D+%5Cto+%5Cmathbb%7BR%7D&bg=ffffff&fg=000&s=0&c=20201002) can be conceptualized as an infinite-dimensional vector, where each point
can be conceptualized as an infinite-dimensional vector, where each point ![x \in [a,b]](https://s0.wp.com/latex.php?latex=x+%5Cin+%5Ba%2Cb%5D&bg=ffffff&fg=000&s=0&c=20201002) corresponds to a component with value
corresponds to a component with value  . In this view, the discrete sum of the dot product becomes a continuous integral.
![[a,b]](https://s0.wp.com/latex.php?latex=%5Ba%2Cb%5D&bg=ffffff&fg=000&s=0&c=20201002) , denoted
, denoted ![L^2([a,b])](https://s0.wp.com/latex.php?latex=L%5E2%28%5Ba%2Cb%5D%29&bg=ffffff&fg=000&s=0&c=20201002) .
. in the space
 can be introduced:
  .
. -norm, which measures the “length” or “magnitude” of a function:
 and
and  are orthogonal if their inner product is zero:
 is an orthogonal basis if its members are mutually orthogonal.
 ![[-\pi, \pi]](https://s0.wp.com/latex.php?latex=%5B-%5Cpi%2C+%5Cpi%5D&bg=ffffff&fg=000&s=0&c=20201002) .
.  is found by projecting
  .
. that is closest to
 , is orthogonal to the subspace
  for all
  .
. . The projection is a scaled version of
  . Using the orthogonality condition:
 . In matrix form for the standard dot product in
  .
. is a vector. This is the vector of the projection. The magnituge of the projection, just the “size” of the shadow so to say, is the
 (with linearly independent columns). The projection
  for some coefficient vector
  . The error vector
  must be orthogonal to the column space of

 . If the columns of
  , and the formula simplifies to
  .
. ) must be orthogonal to the column space of
 .
.
 to get the normal equation. This equation’s name comes from the fact that it enforces the “normal” (orthogonal) condition.


 , is found by solving the normal equation
  .
.  , is the orthogonal projection of the observed target vector
  onto the column space of the design matrix
  .
.  of rank
  be
be  . The best rank-
 (for
(for  ) that minimizes the error
  (in both spectral and Frobenius norms) is given by the truncated SVD sum:
 .
. , there exists a factorization of the form:
 is an Orthogonal Matrix. The columns of
  , denoted
  , are the left-singular vectors. They form an orthonormal basis for the output space (codomain),
  , form an orthonormal basis for the column space (range) of
  is an Orthogonal Matrix. The columns of
  , denoted
  , are the right-singular vectors. They form an orthonormal basis for the input space (domain),
  , form an orthonormal basis for the row space of
  is a Rectangular Diagonal Matrix. The only non-zero entries of
  are on its main diagonal. These entries,
  , are the singular values of
 is the length of the
  or
or  , is the set of all possible linear combinations of its column vectors. If the columns of
  , where each
  , then:
 has a solution.
 or
or  , is the set of all solutions to the homogeneous linear system
  .
.
 exists (a particular solution), then the set of all solutions is given by
  .
.  .
.
 , where the vector


 . By construction,
  is symmetric (
 ) and positive semi-definite (
 ).
).
 is a diagonal matrix of eigenvalues
  .
.
 , which simplifies the expression to:
 , we establish the following fundamental relationships:
 .
. .
. :
:
 .
. .
.
 :
:
 or
or  ? We use the reduced version!
 and
and  , the matrix
  rows of all zeros. These rows, when multiplied by
 ,
,  (now a square diagonal matrix), and
  .
.  represents
  that minimizes
  ) is found by truncating this sum:
 , where
  is formed by taking the reciprocal of the non-zero singular values in
  , is given by
  .
.  to perturbations in the data. It is defined as
 . It can be proven that this is equal to the largest singular value,
  .
. . It can be proven that this is equal to the square root of the sum of the squares of its singular values:
  .
. . The best rank-
 ), denoted
  , is the one that minimizes the approximation error


 and
and  , the problem becomes
  . Since
  is diagonal, this is a sum of independent squared errors:
 for
for  , yielding
  . For
. For  ,
,  is unconstrained as
  ; the minimum-norm solution sets these to zero. Transforming back gives the solution:
 is the Moore-Penrose Pseudoinverse.
  and an upper triangular matrix
  matrix with linearly independent columns. The QR decomposition of
 , where
  is the
  for
for  ).
).

 . We can multiply by
  :
:

![cond(\mathbf{A}^\top\mathbf{A}) = [cond(\mathbf{A})]^2](https://s0.wp.com/latex.php?latex=cond%28%5Cmathbf%7BA%7D%5E%5Ctop%5Cmathbf%7BA%7D%29+%3D+%5Bcond%28%5Cmathbf%7BA%7D%29%5D%5E2&bg=ffffff&fg=000&s=0&c=20201002)
 , where
 be a square matrix.
 . This means
  for all
  (the more you know!).
  , the quadratic form
  is strictly positive.
 ) are strictly positive.
 is a lower triangular matrix with strictly positive diagonal entries (
 ).
). is the transpose of
  . The covariance matrix
  where each component
  is an independent sample from the standard normal distribution
  . This vector
  has a mean of
  and a covariance matrix of
  .
. .
.
![\mathbb{E}[\mathbf{x}] = \mathbb{E}[\boldsymbol{\mu} + \mathbf{L}\mathbf{z}] = \boldsymbol{\mu} + \mathbf{L}\mathbb{E}[\mathbf{z}] = \boldsymbol{\mu}](https://s0.wp.com/latex.php?latex=%5Cmathbb%7BE%7D%5B%5Cmathbf%7Bx%7D%5D+%3D+%5Cmathbb%7BE%7D%5B%5Cboldsymbol%7B%5Cmu%7D+%2B+%5Cmathbf%7BL%7D%5Cmathbf%7Bz%7D%5D+%3D+%5Cboldsymbol%7B%5Cmu%7D+%2B+%5Cmathbf%7BL%7D%5Cmathbb%7BE%7D%5B%5Cmathbf%7Bz%7D%5D+%3D+%5Cboldsymbol%7B%5Cmu%7D&bg=ffffff&fg=000&s=0&c=20201002) .
. .
.
 , where
  is a permutation matrix that records the row swaps.
 slot directly into the matrix.

 (since it is unit triangular).
 (the product of its diagonal elements).
 , where
  is the number of row swaps performed.
 .
. , the expected value is:
![\mathbb{E}[X] = \mu = \int_{-\infty}^{\infty} x p(x) dx](https://s0.wp.com/latex.php?latex=%5Cmathbb%7BE%7D%5BX%5D+%3D+%5Cmu+%3D+%5Cint_%7B-%5Cinfty%7D%5E%7B%5Cinfty%7D+x+p%28x%29+dx&bg=ffffff&fg=000&s=0&c=20201002)
![\text{Var}(X) = \sigma^2 := \mathbb{E}[(X - \mu)^2]](https://s0.wp.com/latex.php?latex=%5Ctext%7BVar%7D%28X%29+%3D+%5Csigma%5E2+%3A%3D+%5Cmathbb%7BE%7D%5B%28X+-+%5Cmu%29%5E2%5D&bg=ffffff&fg=000&s=0&c=20201002)
![\text{Var}(X) = \mathbb{E}[(X^2 - 2\mu X + \mu^2)] = \mathbb{E}[X^2] - 2\mu\mathbb{E}[X] + \mu^2 = \mathbb{E}[X^2] - 2\mu^2 + \mu^2](https://s0.wp.com/latex.php?latex=%5Ctext%7BVar%7D%28X%29+%3D+%5Cmathbb%7BE%7D%5B%28X%5E2+-+2%5Cmu+X+%2B+%5Cmu%5E2%29%5D+%3D+%5Cmathbb%7BE%7D%5BX%5E2%5D+-+2%5Cmu%5Cmathbb%7BE%7D%5BX%5D+%2B+%5Cmu%5E2+%3D+%5Cmathbb%7BE%7D%5BX%5E2%5D+-+2%5Cmu%5E2+%2B+%5Cmu%5E2&bg=ffffff&fg=000&s=0&c=20201002)
![\text{Var}(X) = \mathbb{E}[X^2] - (\mathbb{E}[X])^2](https://s0.wp.com/latex.php?latex=%5Ctext%7BVar%7D%28X%29+%3D+%5Cmathbb%7BE%7D%5BX%5E2%5D+-+%28%5Cmathbb%7BE%7D%5BX%5D%29%5E2&bg=ffffff&fg=000&s=0&c=20201002)
 . We estimate the true variance using the empirical variance (or sample variance). First, the empirical mean is calculated:

 , but for large
  ).
). for that particular sample.
 is the sample mean.
 .
.![E[\cdot]](https://s0.wp.com/latex.php?latex=E%5B%5Ccdot%5D&bg=ffffff&fg=000&s=0&c=20201002) , gives the long-run average of an estimator. For an estimator to be unbiased, its expectation must equal the true parameter, i.e.,
, gives the long-run average of an estimator. For an estimator to be unbiased, its expectation must equal the true parameter, i.e., ![E[s^2] = \sigma^2](https://s0.wp.com/latex.php?latex=E%5Bs%5E2%5D+%3D+%5Csigma%5E2&bg=ffffff&fg=000&s=0&c=20201002) .
.![E\left[\sum(x_i - \bar{x})^2\right]](https://s0.wp.com/latex.php?latex=E%5Cleft%5B%5Csum%28x_i+-+%5Cbar%7Bx%7D%29%5E2%5Cright%5D&bg=ffffff&fg=000&s=0&c=20201002) . We start by rewriting the term inside the sum:
. We start by rewriting the term inside the sum:
![= \sum\left[ (x_i - \mu)^2 - 2(x_i - \mu)(\bar{x} - \mu) + (\bar{x} - \mu)^2 \right]](https://s0.wp.com/latex.php?latex=%3D+%5Csum%5Cleft%5B+%28x_i+-+%5Cmu%29%5E2+-+2%28x_i+-+%5Cmu%29%28%5Cbar%7Bx%7D+-+%5Cmu%29+%2B+%28%5Cbar%7Bx%7D+-+%5Cmu%29%5E2+%5Cright%5D&bg=ffffff&fg=000&s=0&c=20201002)

 , which equals
  . Substituting this in:


![E\left[\sum(x_i - \bar{x})^2\right] = E\left[\sum(x_i - \mu)^2\right] - E\left[N(\bar{x} - \mu)^2\right]](https://s0.wp.com/latex.php?latex=E%5Cleft%5B%5Csum%28x_i+-+%5Cbar%7Bx%7D%29%5E2%5Cright%5D+%3D+E%5Cleft%5B%5Csum%28x_i+-+%5Cmu%29%5E2%5Cright%5D+-+E%5Cleft%5BN%28%5Cbar%7Bx%7D+-+%5Cmu%29%5E2%5Cright%5D&bg=ffffff&fg=000&s=0&c=20201002)
![E[(x_i - \mu)^2]](https://s0.wp.com/latex.php?latex=E%5B%28x_i+-+%5Cmu%29%5E2%5D&bg=ffffff&fg=000&s=0&c=20201002) is the population variance
is the population variance ![E[(\bar{x} - \mu)^2]](https://s0.wp.com/latex.php?latex=E%5B%28%5Cbar%7Bx%7D+-+%5Cmu%29%5E2%5D&bg=ffffff&fg=000&s=0&c=20201002) is the variance of the sample mean, which is
is the variance of the sample mean, which is ![E\left[\sum(x_i - \bar{x})^2\right] = \sum E[(x_i - \mu)^2] - N \cdot E[(\bar{x} - \mu)^2]](https://s0.wp.com/latex.php?latex=E%5Cleft%5B%5Csum%28x_i+-+%5Cbar%7Bx%7D%29%5E2%5Cright%5D+%3D+%5Csum+E%5B%28x_i+-+%5Cmu%29%5E2%5D+-+N+%5Ccdot+E%5B%28%5Cbar%7Bx%7D+-+%5Cmu%29%5E2%5D&bg=ffffff&fg=000&s=0&c=20201002)


 since for
  .
. and
and  respectively, is the expected value of the product of their deviations from their means:
![\text{Cov}(X, Y) := \mathbb{E}[(X - \mu_X)(Y - \mu_Y)]](https://s0.wp.com/latex.php?latex=%5Ctext%7BCov%7D%28X%2C+Y%29+%3A%3D+%5Cmathbb%7BE%7D%5B%28X+-+%5Cmu_X%29%28Y+-+%5Cmu_Y%29%5D&bg=ffffff&fg=000&s=0&c=20201002)
![\mathbf{X} = [X_1, \dots, X_D]^\top](https://s0.wp.com/latex.php?latex=%5Cmathbf%7BX%7D+%3D+%5BX_1%2C+%5Cdots%2C+X_D%5D%5E%5Ctop&bg=ffffff&fg=000&s=0&c=20201002) with mean vector
with mean vector ![\boldsymbol{\mu} = \mathbb{E}[\mathbf{X}]](https://s0.wp.com/latex.php?latex=%5Cboldsymbol%7B%5Cmu%7D+%3D+%5Cmathbb%7BE%7D%5B%5Cmathbf%7BX%7D%5D&bg=ffffff&fg=000&s=0&c=20201002) , the relationships between all pairs of its components are captured by the covariance matrix
, the relationships between all pairs of its components are captured by the covariance matrix  .
.![\mathbf{\Sigma} := \mathbb{E}[(\mathbf{X} - \boldsymbol{\mu})(\mathbf{X} - \boldsymbol{\mu})^\top]](https://s0.wp.com/latex.php?latex=%5Cmathbf%7B%5CSigma%7D+%3A%3D+%5Cmathbb%7BE%7D%5B%28%5Cmathbf%7BX%7D+-+%5Cboldsymbol%7B%5Cmu%7D%29%28%5Cmathbf%7BX%7D+-+%5Cboldsymbol%7B%5Cmu%7D%29%5E%5Ctop%5D&bg=ffffff&fg=000&s=0&c=20201002)
 of this matrix is the covariance between the
 .
. , since
  .
. ,
,  . This is because
  , and variance is always non-negative! (since it’s a square, duh)
 is an estimator for the population mean
  . A crucial property of an estimator is its bias.
 be an estimator of
 ![\text{Bias}(\hat{\theta}) = \mathbb{E}[\hat{\theta}] - \theta](https://s0.wp.com/latex.php?latex=%5Ctext%7BBias%7D%28%5Chat%7B%5Ctheta%7D%29+%3D+%5Cmathbb%7BE%7D%5B%5Chat%7B%5Ctheta%7D%5D+-+%5Ctheta&bg=ffffff&fg=000&s=0&c=20201002)
![\mathbb{E}[\hat{\theta}] = \theta](https://s0.wp.com/latex.php?latex=%5Cmathbb%7BE%7D%5B%5Chat%7B%5Ctheta%7D%5D+%3D+%5Ctheta&bg=ffffff&fg=000&s=0&c=20201002) . This means that if we were to repeatedly draw samples of size
. This means that if we were to repeatedly draw samples of size ![\mathbb{E}[\hat{\theta}] \neq \theta](https://s0.wp.com/latex.php?latex=%5Cmathbb%7BE%7D%5B%5Chat%7B%5Ctheta%7D%5D+%5Cneq+%5Ctheta&bg=ffffff&fg=000&s=0&c=20201002) .
.![\mathbb{E}[\hat{\sigma}^2_{N-1}] = \mathbb{E}\left[\frac{N}{N-1}\hat{\sigma}^2_N\right] = \frac{N}{N-1}\mathbb{E}[\hat{\sigma}^2_N] = \frac{N}{N-1} \left( \frac{N-1}{N}\sigma^2 \right) = \sigma^2](https://s0.wp.com/latex.php?latex=%5Cmathbb%7BE%7D%5B%5Chat%7B%5Csigma%7D%5E2_%7BN-1%7D%5D+%3D+%5Cmathbb%7BE%7D%5Cleft%5B%5Cfrac%7BN%7D%7BN-1%7D%5Chat%7B%5Csigma%7D%5E2_N%5Cright%5D+%3D+%5Cfrac%7BN%7D%7BN-1%7D%5Cmathbb%7BE%7D%5B%5Chat%7B%5Csigma%7D%5E2_N%5D+%3D+%5Cfrac%7BN%7D%7BN-1%7D+%5Cleft%28+%5Cfrac%7BN-1%7D%7BN%7D%5Csigma%5E2+%5Cright%29+%3D+%5Csigma%5E2&bg=ffffff&fg=000&s=0&c=20201002)
 and a parameterized probability model
  , the likelihood function is the probability of observing the data, viewed as a function of the parameters
  :
:
 that maximize this likelihood function. For an i.i.d. sample, this is equivalent to maximizing the log-likelihood:

 , I expect to see roughly 5 heads in 10 flips.”)
 as a probability distribution over possible datasets
  , for a fixed parameter setting
  , treats the observed data
  are drawn i.i.d. from a multivariate Gaussian distribution,
  .
.
 (the sample mean)

![\mathbb{E}[\mathbf{S}_N] = \frac{N-1}{N}\mathbf{\Sigma}](https://s0.wp.com/latex.php?latex=%5Cmathbb%7BE%7D%5B%5Cmathbf%7BS%7D_N%5D+%3D+%5Cfrac%7BN-1%7D%7BN%7D%5Cmathbf%7B%5CSigma%7D&bg=ffffff&fg=000&s=0&c=20201002)

![\mathbb{E}[\mathbf{S}_{N-1}] = \mathbf{\Sigma}](https://s0.wp.com/latex.php?latex=%5Cmathbb%7BE%7D%5B%5Cmathbf%7BS%7D_%7BN-1%7D%5D+%3D+%5Cmathbf%7B%5CSigma%7D&bg=ffffff&fg=000&s=0&c=20201002) .
. is the standard. In statistical analysis (e.g., hypothesis testing, confidence intervals), using an unbiased estimate of variance is critical for the validity of the statistical procedures. The focus is on estimation accuracy.
![\text{MSE}(\hat{\theta}) = \mathbb{E}[(\hat{\theta} - \theta)^2] = (\text{Bias}(\hat{\theta}))^2 + \text{Var}(\hat{\theta})](https://s0.wp.com/latex.php?latex=%5Ctext%7BMSE%7D%28%5Chat%7B%5Ctheta%7D%29+%3D+%5Cmathbb%7BE%7D%5B%28%5Chat%7B%5Ctheta%7D+-+%5Ctheta%29%5E2%5D+%3D+%28%5Ctext%7BBias%7D%28%5Chat%7B%5Ctheta%7D%29%29%5E2+%2B+%5Ctext%7BVar%7D%28%5Chat%7B%5Ctheta%7D%29&bg=ffffff&fg=000&s=0&c=20201002)
 has a slightly lower variance than the unbiased estimator
  . Therefore, if the goal is to find an estimator that is “closer” to the true value on average in terms of squared error, the biased MLE is superior.
 is the data matrix with observations as rows. This is when we are dealing with a centered dataset, i.e., the sample mean,
  .
. ; it is reflects the dimenions, NOT the samples.
  in less than
  such that the number of these coordinate vectors is less than
  .
. , onto which the projected data has the greatest variance.
 onto the direction
  results in a scalar coordinate
  . The variance of these projected coordinates over the entire dataset is:


 . This is a constrained optimization problem:


 , we must choose
  to be the largest eigenvalue of
  are found by finding the eigenvectors of
  -dimensional subspace spanned by an orthonormal basis of vectors
![\mathbf{B} = [\mathbf{b}_1, \dots, \mathbf{b}_M] \in \mathbb{R}^{D \times M}](https://s0.wp.com/latex.php?latex=%5Cmathbf%7BB%7D+%3D+%5B%5Cmathbf%7Bb%7D_1%2C+%5Cdots%2C+%5Cmathbf%7Bb%7D_M%5D+%5Cin+%5Cmathbb%7BR%7D%5E%7BD+%5Ctimes+M%7D&bg=ffffff&fg=000&s=0&c=20201002) .
.  .
.  that minimizes the average squared reconstruction error:
 . Since the total variance
  is fixed, minimizing the reconstruction error is equivalent to maximizing the projected variance
  .
.  is a manifestation of some simpler, unobserved (latent) cause
  , where
  .
.
 :
:
 , where:
 is a matrix that maps the latent space to the data space. Its columns can be interpreted as the basis vectors of the principal subspace.
 is the mean of the data.
 is isotropic Gaussian noise, which accounts for the variability of data off the principal subspace.
 :
:
 are Gaussian, and the relationship is linear, this integral can be solved analytically. The resulting marginal distribution is also a Gaussian,
  , with mean and covariance:
![\mathbb{E}[\mathbf{x}] = \mathbb{E}[\mathbf{B}\mathbf{z} + \boldsymbol{\mu} + \boldsymbol{\epsilon}] = \mathbf{B}\mathbb{E}[\mathbf{z}] + \boldsymbol{\mu} + \mathbb{E}[\boldsymbol{\epsilon}] = \boldsymbol{\mu}](https://s0.wp.com/latex.php?latex=%5Cmathbb%7BE%7D%5B%5Cmathbf%7Bx%7D%5D+%3D+%5Cmathbb%7BE%7D%5B%5Cmathbf%7BB%7D%5Cmathbf%7Bz%7D+%2B+%5Cboldsymbol%7B%5Cmu%7D+%2B+%5Cboldsymbol%7B%5Cepsilon%7D%5D+%3D+%5Cmathbf%7BB%7D%5Cmathbb%7BE%7D%5B%5Cmathbf%7Bz%7D%5D+%2B+%5Cboldsymbol%7B%5Cmu%7D+%2B+%5Cmathbb%7BE%7D%5B%5Cboldsymbol%7B%5Cepsilon%7D%5D+%3D+%5Cboldsymbol%7B%5Cmu%7D&bg=ffffff&fg=000&s=0&c=20201002) .
. .
. ) are found by maximizing the log-likelihood of the observed data under this marginal distribution. How to do this? I dunno and I can’t write that much latex. Go read a book for this please (note to self – code is available thankfully).
 . The mapping
  is chosen such that the structure of the mapped data
  becomes linear in
 , where
  are the principal components in the feature space.


 , is just a scalar (a single number) because it’s a dot product divided by constants.
 , we get the exact relationship shown on the slide:
 , we construct a graph
  , where the set of vertices
  , where
  is the similarity between points
  and
and  . High values indicate high similarity.
  .
. . An ideal partition is one where the edges within a cluster have high weights (high intra-cluster similarity) and the edges between clusters have low weights (low inter-cluster similarity). This is known as finding a minimal graph cut.
 is the sum of weights of all edges connected to vertex

 turns into a square term, so it is positive semi-definite (or semi positive definite). Or, ctrl + F and find quadratic-laplacian-square.
 , with the corresponding eigenvector being the vector of all ones,
  .
.
 ).
). and its complement
  .
.
 where:
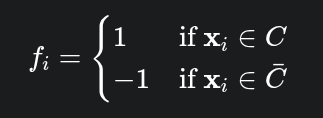
 .
.


 :
: (i.e., both nodes are in the same partition),
  .
. (i.e., nodes are in different partitions),
  .
. with the constraint that
  is still combinatorial.
 can take any real values now. So, we get
 with eigenvector
  subject to
  and
and 
 .
. of
of  with these eigenvectors as its columns.
 ).
). , the t-distribution converges to the Gaussian distribution.
 , is different from a second, reference probability distribution,
 . This is interpreted as
 over all other points, where
  . The Shannon entropy of this distribution, measured in bits, is:
 quantifies the uncertainty involved in choosing a neighbor for point

 .
.

 gives half of what
 between two vector spaces
 that preserves the operations of vector addition and scalar multiplication. For finite-dimensional vector spaces, any linear transformation
 can be represented by an
  is given by matrix-vector multiplication:
 .
. such that
  . The scalar
  is called the eigenvalue corresponding to the eigenvector
  (the result of the transformation) is collinear (fancy term for along the same line) with the original vector
  , the eigenvector is stretched.
 , the eigenvector is compressed.
 , the eigenvector is flipped and scaled.
 , the eigenvector is unchanged.
 , the eigenvector is mapped to the zero vector, meaning it lies in the null space of
  is a polynomial in
  for
for  ) and inverses (
 ) are trivial to compute.
 ): Square matrices that are either lower triangular (
 for
for  for
for  , which implies
  .
. , where:
 is a matrix whose columns are the
 ![\mathbf{P} = [\mathbf{p}_1, \mathbf{p}_2, \dots, \mathbf{p}_n]](https://s0.wp.com/latex.php?latex=%5Cmathbf%7BP%7D+%3D+%5B%5Cmathbf%7Bp%7D_1%2C+%5Cmathbf%7Bp%7D_2%2C+%5Cdots%2C+%5Cmathbf%7Bp%7D_n%5D&bg=ffffff&fg=000&s=0&c=20201002) .
. is a diagonal matrix whose diagonal entries are the corresponding eigenvalues,
  .
. is the inverse of the matrix
  with corresponding eigenvalues
  . We can write the
![\mathbf{P} = [\mathbf{p}_1, \dots, \mathbf{p}_n]](https://s0.wp.com/latex.php?latex=%5Cmathbf%7BP%7D+%3D+%5B%5Cmathbf%7Bp%7D_1%2C+%5Cdots%2C+%5Cmathbf%7Bp%7D_n%5D&bg=ffffff&fg=000&s=0&c=20201002) . Then:
. Then:![\mathbf{A}\mathbf{P} = \mathbf{A}[\mathbf{p}_1, \dots, \mathbf{p}_n] = [\mathbf{A}\mathbf{p}_1, \dots, \mathbf{A}\mathbf{p}_n] = [\lambda_1\mathbf{p}_1, \dots, \lambda_n\mathbf{p}_n]](https://s0.wp.com/latex.php?latex=%5Cmathbf%7BA%7D%5Cmathbf%7BP%7D+%3D+%5Cmathbf%7BA%7D%5B%5Cmathbf%7Bp%7D_1%2C+%5Cdots%2C+%5Cmathbf%7Bp%7D_n%5D+%3D+%5B%5Cmathbf%7BA%7D%5Cmathbf%7Bp%7D_1%2C+%5Cdots%2C+%5Cmathbf%7BA%7D%5Cmathbf%7Bp%7D_n%5D+%3D+%5B%5Clambda_1%5Cmathbf%7Bp%7D_1%2C+%5Cdots%2C+%5Clambda_n%5Cmathbf%7Bp%7D_n%5D&bg=ffffff&fg=000&s=0&c=20201002)
![[\lambda_1\mathbf{p}_1, \dots, \lambda_n\mathbf{p}_n] = [\mathbf{p}_1, \dots, \mathbf{p}_n] \begin{bmatrix} \lambda_1 & 0 & \dots & 0 \\ 0 & \lambda_2 & \dots & 0 \\ \vdots & \vdots & \ddots & \vdots \\ 0 & 0 & \dots & \lambda_n \end{bmatrix} = \mathbf{P}\mathbf{D}](https://s0.wp.com/latex.php?latex=%5B%5Clambda_1%5Cmathbf%7Bp%7D_1%2C+%5Cdots%2C+%5Clambda_n%5Cmathbf%7Bp%7D_n%5D+%3D+%5B%5Cmathbf%7Bp%7D_1%2C+%5Cdots%2C+%5Cmathbf%7Bp%7D_n%5D+%5Cbegin%7Bbmatrix%7D+%5Clambda_1+%26+0+%26+%5Cdots+%26+0+%5C%5C+0+%26+%5Clambda_2+%26+%5Cdots+%26+0+%5C%5C+%5Cvdots+%26+%5Cvdots+%26+%5Cddots+%26+%5Cvdots+%5C%5C+0+%26+0+%26+%5Cdots+%26+%5Clambda_n+%5Cend%7Bbmatrix%7D+%3D+%5Cmathbf%7BP%7D%5Cmathbf%7BD%7D&bg=ffffff&fg=000&s=0&c=20201002)
 . Since the eigenvectors are linearly independent, the matrix


 ) of both sides:

 ). This simplifies the equation to:

 :
:


 is the squared magnitude of the vector
 be two distinct eigenvalues (
 ) of
) of  and
and  . We have:

 :
:


 ), this becomes:
 :
:


 . For the product to be zero, the other term must be zero:

 ) to align the coordinate system with the eigenvectors.
 . The correct sequence of geometric operations is: